Wednesday, 19 November 2014

Dollar Weakens, Ukraine Freaking


Editor's Note: Technical expert and star of Kitco's popular show Chart This!, Gary Wagner will now provide Kitco.com visitors with an exclusive evening recap Monday to Thursday at 6:00 p.m. EST. The commentary, called Hawaii Six-O, will provide a brief overview of the day's news as it relates to gold. A former city guy, Gary abandoned the briefcase and tie, and joins us now daily from Hawaii. Whether you are a newbie or veteran trader, Gary provides a great overview for all levels of investors.
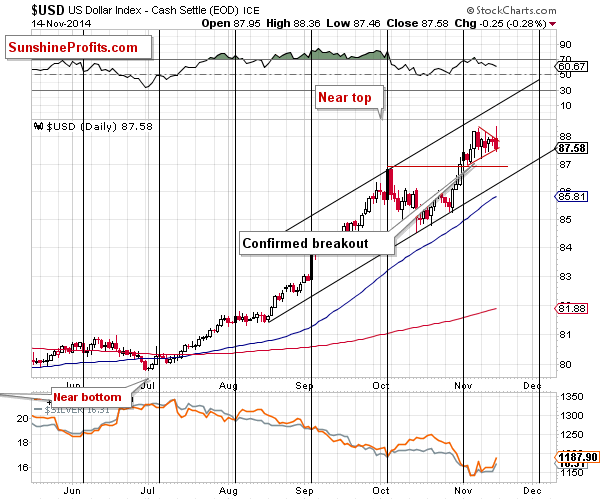
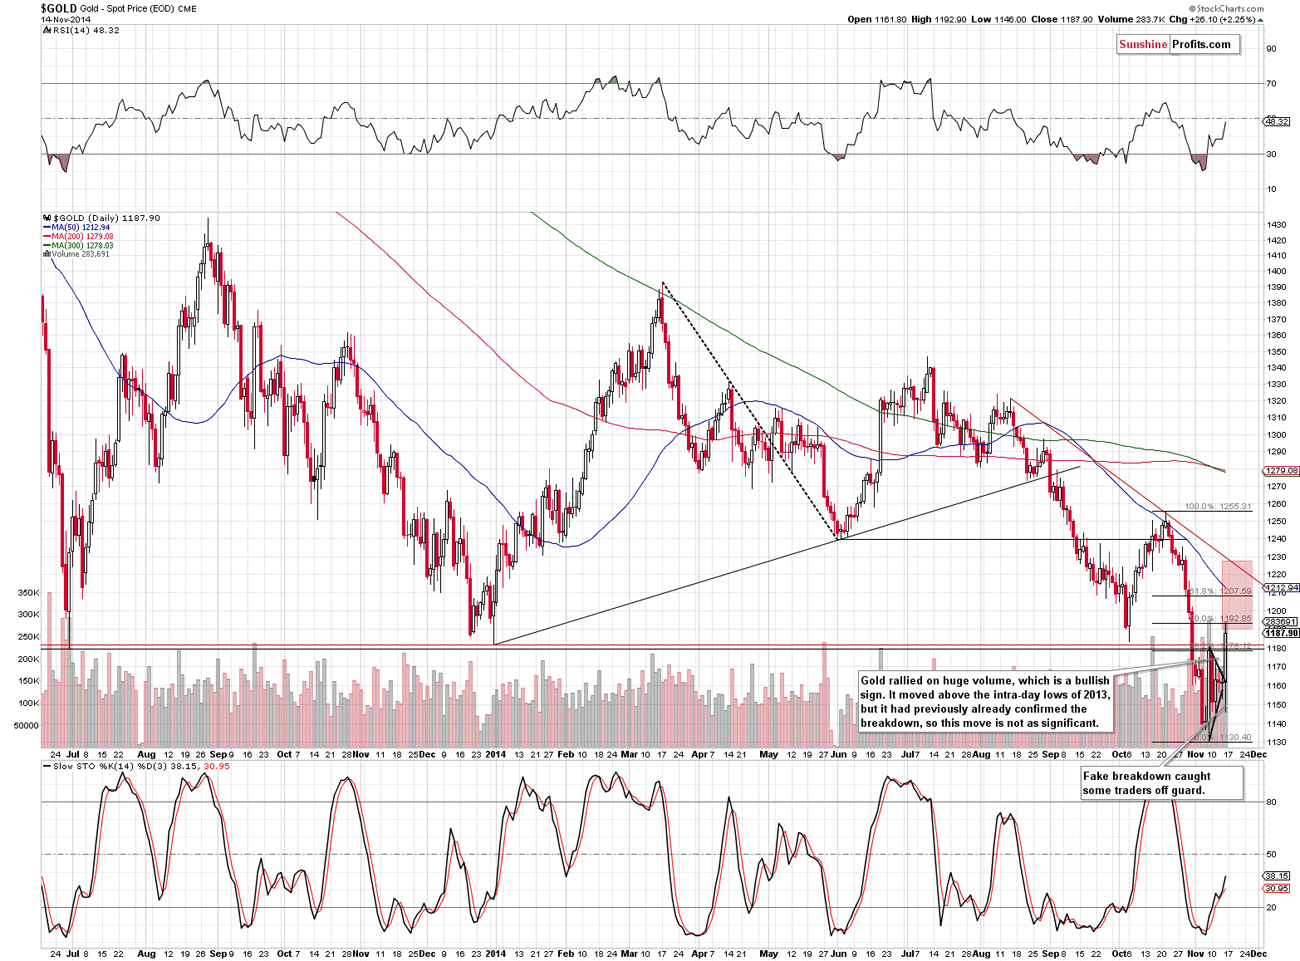
The euro turned bullish today and that drove the U.S. dollar down, thus pushing gold prices up.
The tensions in Ukraine between, on one hand the eastern and western parts of the country, and on the other between Russia and the West, are rising.
German economic sentiment index rose by 15.1 to a four-month high of 11.5 this month over October's reading of -3.6. Most analysts had expected the index to improve by 4.5 points to 0.9 in November.
In addition, the index of the full euro zone's sentiment increased to 11.0 in October, up from 4.1 in September, well above expectations of 4.3. The unexpected rises gave the euro the shot in the arm it was looking for.
In the U.S., meanwhile, inflation seems to be warming up, though scarcely can it be considered as heated. Drops in fuel prices, stagnation in durables and the usual inflationary questions about food prices are keeping the rate just below where the Fed said it wants inflation to be.
On to the Ukrainian crisis... Why Vlad Putin wants a war with Ukraine is anyone's guess. We imagine he's thinking nationalism trumps economics. Without citing at least three or four dozen historical examples to back our thinking up, suffice it to say that nationalism does not trump economic interest. In fact, economics is a huge part of national success.
The Ukrainians are not backing down from the bully, either. It seems there was, for a while back in September, a chance that Ukrainians were willing to let Crimea go and Russia was willing to keep out of the issues concerning "Russian" areas of Ukraine. Of course, that's now fallen apart.
And here we are on the brink of a nasty land war in Russia/Ukraine. And, if the Russians think they are immune from attack, they haven't been paying attention to the upgrades to the Ukrainian forces courtesy of NATO.
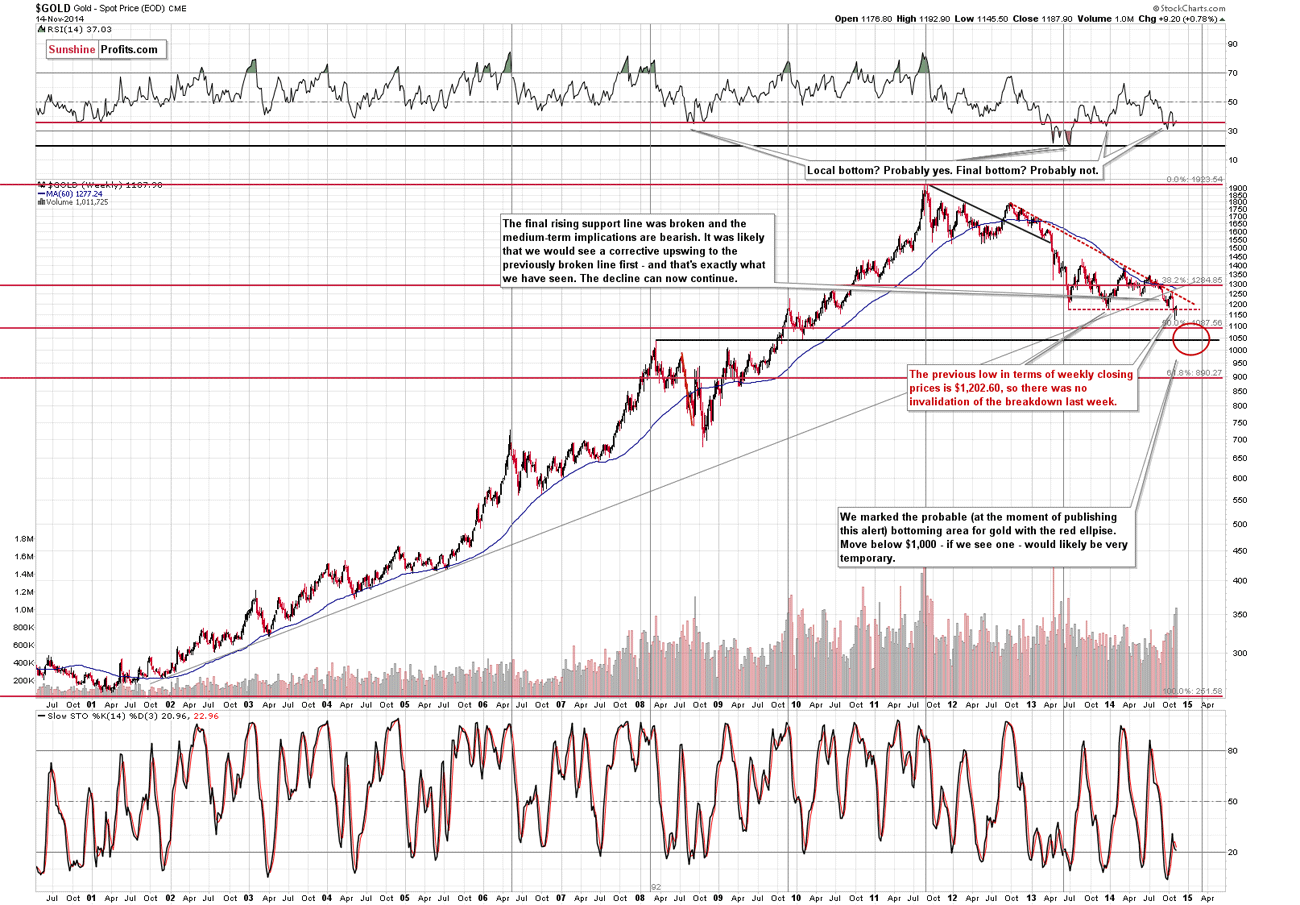
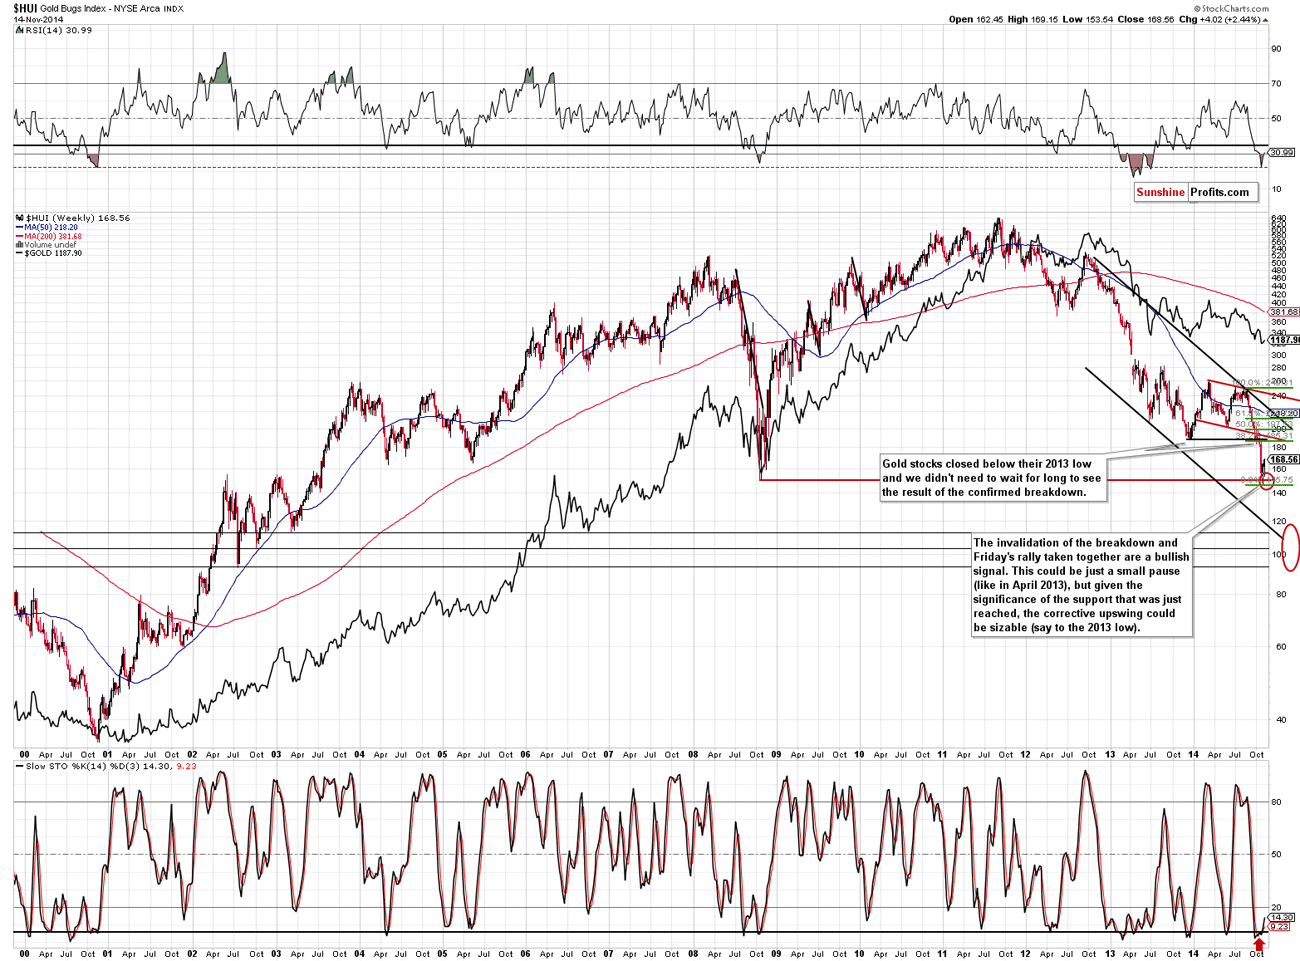
Regardless of other causes and consequences, we know that the turmoil is helping gold prices rise. And that's just in time for Russia's big gold-buying spree. Russia had better buy gold. Their currency is becoming less useful by the day.
Yet another worry for Vlad is the continuing decline in energy prices. Today, in spite of a weaker dollar, WTI crude is down 1.80%, Brent is down over 1% and natural gas is down almost 2%.
Bond yields are flat. All risk-on plays went to the euro and, to some extent, gold. Oh, and that other investment type...
Are the equities markets plowing ahead? Yes they are. So risk money is continuing to be pushed into stocks and records are being broken almost daily.
EDITOR'S NOTE: Please be aware of this month's travel and holiday schedule, which will run through November 30th, including Thanksgiving. Additionally, during that period, I will be in Indonesia, lecturing to key gold traders there. The time differential will make it necessary for me to send out the regular fundamentals (upper portion) of the newsletter at the usual time. The videos' timing may be different. You will receive special notification immediately following the release of a new video, which will appear on the website. Of course, trade alerts will not change. I will monitor markets as usual and have all equipment necessary to produce videos. Thank you.

Gold & Silver Trading Alert:
Gold and Miners Soar on Huge Volume

Przemyslaw Radomski

Briefly: In our opinion no speculative positions are currently justified from the risk/reward perspective.
Gold moved substantially higher on Friday and the volume was huge. The session was both significant and bullish, but the question remains if such show of strength can be a start of the next big move. As we promised in Friday’s second alert, we analyzed the situation thoroughly over the weekend and are reporting to you today.
Let’s jump right into charts (charts courtesy of http://stockcharts.com).
First of all, let’s take a look at something that didn’t change – the situation in the USD Index.
(Click on images to enlarge)
The Index remains in the triangle pattern. The important thing to keep in mind is the intra-day attempt to break above the upper border of the pattern, which was invalidated shortly thereafter.
If the USD Index breaks down from the triangle patter, it’s not likely to fall much further – there are short-term support levels at the Oct. high and the rising black support line. We don’t expect the USD Index to move visibly below the 86.4 - 87 area. We would expect the rally to resume after this area is reached.
On the other hand, if the USD Index does indeed rally right away, then it could move much higher before it really tops (above 89).
Theoretically, this means that gold has limited short-term upside and bigger downside. Does it?
The significant downside is definitely present, as there was no move above the declining (red, dashed) resistance line and gold didn’t close the week above the previous 2013 low (in terms of weekly closing prices).
On the short-term chart we see that gold corrected to another importantretracement level – the 50% one. Is it enough to stop the rally? It’s certainly possible, but after such a sizable daily rally on strong volume, we can expect some more strength in the coming day(s). So, how high can gold go? To the following resistance levels, of course. The next one is the 61.8% Fibonacci retracement, and a bit higher we have the declining short-term resistance line. It seems likely to us that one of them will stop the rally, as they more or less correspond to the support levels in the USD Index. Which of them is more likely? It’s a touch call at this time – it seems that focusing on other markets / ratios and waiting for a confirmation is a good idea at this time.
Speaking of ratios – can the gold:USD Index ratio tell us something?
Yes, but that’s generally a confirmation of what we’ve already written above – that gold could move a bit higher before it continues to slide. In this case, we would see a move back to the previously broken horizontal support and then a continuation of the decline.
From the non-USD perspective, we have no decisive signal. On one hand we’ve just seen a weekly reversal on strong volume, which is a bullish sign, but on the other hand we’ve just seen another move back to the previously broken rising support/resistance line (the breakdown was not invalidated, so the implications remain bearish).
Let’s move to silver.
From the long-term perspective, the consolidation seems to continue, which is in tune with what we saw in April 2013. The analogy to this month has bearish implications as back then declines followed. Please note that silver spent a few weeks trading back and forth before its decline continued, so just because silver is not moving lower again is not concerning.
In Friday’s first alert, we wrote the following:
By opening short positions now, we would risk being thrown out of them if PMs rallied temporarily and sharply before declining again. Please recall that silver has been known for such counter-trend rallies right before plunging.
On the short-term SLV ETF chart we see that the rally was very significant on a daily basis. It was definitely good to watch this from the sidelines instead of keeping a short position open. Silver moved to the 20-day moving average, but does it mean that silver can’t move higher? It could – it’s currently correcting a huge decline, so we wouldn’t be surprised to see a move even higher – to the declining resistance line – before the upswing is over. Please note that in October silver also moved temporarily above the 20-day moving average only to decline shortly thereafter.
Examining silver from the non-USD perspective provides us with the same outcome as the analysis of the gold charts. Namely, the corrective upswing is likely not over yet, but it’s not likely to take metals much higher either.
Let’s take a look at gold stocks.
Gold miners have their resistance level relatively high, but since they are ones that have recently dropped particularly significantly, it’s no wonder that the correction is also big. Our comments from the Nov. 10 alertremain up-to-date:
Gold stocks moved higher last week after reaching our initial target area but that’s no proof that the decline is completely over. During the 2008 decline there were sharp corrective upswings as well, but they didn’t mean that the decline was over. The current decline has been significant, so a corrective upswing (a pause within the decline) would be something normal.
How high could gold stocks go before the decline is resumed? It’s a tough call as the market has been very volatile lately, but at this time we wouldn’t rule out a move back to the previously broken support at the 2013 low. The 38.2% Fibonacci retracement based on the recent decline is very close to it, so it seems quite likely that the 185-190 level would stop a rally.
Junior miners can also tell us something (more precisely, their performance relative to other stocks).
The above chart features the GDXJ to SPY ratio, which means that it will move higher when juniors rally faster than the general stock market. The volume is actually the ratio of volumes. The things that are particularly interesting are situations when we see sudden spikes in the volume (a ratio of volumes). This is when juniors are a particularly “hot topic” – of course on a relative basis. The useful tendency is that these times very often precede or mark important price tops in the precious metals sector. The spikes that we saw in the last 2 weeks were historically high. They were so huge that they made the spikes seen before 2013 barely visible on the above chart. Consequently, the bearish medium-term implications are clearly in place and based on them we could expect another downswing soon, but not necessarily right away. This is in tune with what we concluded based on the analysis of the previous charts.
Summing up, the precious metals sector continues to correct its recent downswing, while remaining in the medium-term downtrend, and it seems that it will move a bit higher before turning south again.
As always, we will continue to monitor the situation and report to you – our subscribers – accordingly. We will aim to multiply the recent profits and will quite likely open another trading position shortly – stay tuned.
To summarize:
Trading capital (our opinion): No positions
Long-term capital (our opinion): No positions
Insurance capital (our opinion): Full position
You will find details on our thoughts on gold portfolio structuring in theKey Insights section on our website.
As always, we'll keep our subscribers updated should our views on the market change. We will continue to send them our Gold & Silver Trading Alerts on each trading day and we will send additional ones whenever appropriate. If you'd like to receive them, please subscribe today.
We were bullish on gold as far medium-term is concerned for the vast majority of the time until April 2013. After that we have generally been expecting lower prices. Are we gold bears? No - we view this decline as lengthy, but temporary. We expect gold to rally in the coming years, but instead of following the buy-and-hold approach, we exit the long-term precious investments at the most unfavorable times and re-enter when things look good again, thus saving a lot of money. Additionally, our Gold & Silver Trading Alerts help you profit from the short-term price swings. We invite you to examine our premium services and encourage you to sign up for our free mailing list today.

Gold: Bull Flag In Play

  1. Just hours ago, gold staged a nice upside breakout, from a bullish flag pattern. To view this exciting action on a short term chart, pleaseclick here now.
  2. After rising from an inverse head and shoulders bottom pattern, gold promptly formed a bull flag. The target of this pattern is the $1235 - $1240 price zone.
  3. Please click here now. That’s also an hourly bars chart, with the uptrend channel highlighted. A rise above $1200 could usher in a lot of momentum-oriented buying, creating a near-vertical surge to the $1235 -$1240 price zone.
  4. In my professional opinion, gold demand in India for Diwali has been the main price driver of this rally, and that demand has overwhelmed speculators carrying short positions on the COMEX.
  5. Tremendous corruption exists in the Indian government, and the bullion banks that have traditionally controlled most gold imports, are not happy with the recent decision of the Indian central bank to allow non-bank entities to compete with them.
  6. The profits made by the bullion banks have shrunk from $100 - $200 an ounce to just $10 - $20 an ounce. As a result, the banks and the Indian finance ministry are putting tremendous pressure on the Indian central bank to restore the bullion bank imports cartel.
  7. India is likely to announce measures to curb gold imports as early as Tuesday, a senior finance ministry source said…. "We are working on it. The measures to slow gold imports are almost ready and may be announced today or tomorrow," said the source, who declined to be named because of the sensitivity of the matter.’ –Reuters News, November 18, 2014.
  8. A new round of restrictions appears to be imminent. That will empower the mafia and the bullion banks, but it’s unlikely to change the total amount of gold being imported into India.
  9. Even if India has to take a step or two backwards temporarily, an important policy maker at the European Central Bank has just suggested that the ECB could begin a gold buying program. This is fabulous news for the Western gold community.
  10. The Board of Governors has unanimously advocated, where appropriate, to take further unconventional measures to counteract a lengthy period to lower inflation. Theoretically, this also includes the purchase of government bonds or other assets such as gold, shares, Exchange Traded Funds (ETF) etc.” –Yves Mersch, ECB Executive board member, in a speech posted on the ECB website yesterday. To view the entire speech, using the Google translator, please click here now.
  11. Mersch speaks forcefully, about the need to raise the European inflation rate.
  12. My Indian jeweller contacts believe gold and silver can rally for several more weeks before suffering a significant sell-off. Please click here now. That’s the daily silver chart, and it looks ready to rally.
  13. There’s also a potential flag pattern in play on that chart. To view it, please click here now. A breakout from the flag pattern appears to be imminent. That could help ignite a period of outperformance by silver against gold!
  14. When gold and silver stage a tradable rally, the mining stocks tend to do very well. On that note, please click here now. This GDX daily chart suggests that gold stocks are poised to rally to $20, $22, and perhaps to $25.60, before any kind of shorting or selling opportunity presents itself.
  15. I think the $25.60 price target is realistic and achievable. To understand my thinking on this key issue, please click here now. That’s the GDX weekly chart, and it looks superb.
  16. Note the action of the 14,3,3 Stochastics oscillator. GDX can easily rally ten dollars on a crossover buy signal, and it seems poised to do so right now.
  17. Please click here now. That’s the GDXJ daily chart. Junior gold stocks tend to outperform the seniors during a serious rally, just as silver tends to outperform gold, during a serious precious metals price rally.
  18. If GDX can rise to $25.60, and I think it can, then GDXJ should rise to $40.
  19. A lot of amateur investors have been caught off guard by this precious metals rally. There are a number of reasons for that, and an overly-simplistic view of the relationship between the Japanese yen and gold is one reason for their failure.
  20. Many of them were carrying large short positions in gold. Carrying a small tactical short position is the action of a professional investor. In contrast, wildly shorting the world’s ultimate asset with large amounts of leverage is very dangerous.
  21. Most fans of the yen-gold relationship thought that when the US dollar surged against the yen, it would surge against gold, but the opposite has now occurred; gold is surging against the dollar!
  22. Please click here now. That’s the weekly chart of the US dollar versus the Japanese yen. The dollar’s upside progress is fading. The Stochastics oscillator looks ready to move sharply lower. If gold can move aggressively higher while the yen is collapsing, as it is now, one can only imagine the potential “super surge” in the gold price, if the yen begins to rally.
  23. I think that situation is going to occur very soon. I also would not be too quick to count out the head of the Indian central bank, Raghuram Rajan. He is a master tactician and strategist, and turned the 80-20 import rule against the bullion banks, by adjusting the fine print of the rule. In India, home of the most powerful gold demand in the world, oil prices have fallen, the rupee is stable, inflation is moderating quickly, GDP is growing, and the current account deficit is now a tiny part of GDP. Yet, incredibly, the government and the bullion banks still seem obsessed with claiming that buying gold is a cause of financial weakness. This makes them look corrupt and ridiculous. 
  24. Gold is in a tremendously strong position right now. The weekly charts are very bullish, and flag patterns are in play on the shorter term charts. Fundamentally, India is a force to be reckoned with for decades to come. The Swiss referendum is a bullish wild card, and the potential for the ECB to become a gold buyer is growing. Almost all the lights are green, for gold!