This is featured post 2 title
Replace these every slider sentences with your featured post descriptions.Go to Blogger edit html and find these sentences.Now replace these with your own descriptions.This theme is Bloggerized by Lasantha - Premiumbloggertemplates.com.

This is featured post 3 title
Replace these every slider sentences with your featured post descriptions.Go to Blogger edit html and find these sentences.Now replace these with your own descriptions.This theme is Bloggerized by Lasantha - Premiumbloggertemplates.com.

Thursday, 4 December 2014


Gold prices ended the U.S. day session steady to slightly lower Thursday, on some technical chart consolidation. After an early-morning flurry of activity, gold trading settled down as market watchers began to focus on Friday’s U.S. employment report. February Comex gold was last down $0.50 at $1,208.20 an ounce. Spot gold was last down $0.90 at $1,209.30. March Comex silver last traded up $0.148 at $16.56 an ounce.
Gold prices pushed to their daily highs Thursday morning, in the immediate aftermath of dovish comments from European Central Bank president Mario Draghi, during his monthly press conference following the ECB monthly meeting. The Euro currency rallied and the U.S. dollar index sold off on Draghi’s remarks, which was bullish for the gold market. However, gold prices quickly backed down to trade modestly lower, and where they were before the Draghi press conference began. Draghi did mention that gold would not be part of any new monetary policy stimulus measures, but most traders and investors reckoned that to be the case, anyway. The European Central Bank held interest rates steady at its monthly meeting Thursday, as most expected. Draghi indicated Thursday the ECB will make its move in the first quarter of 2015.
The Bank of England Thursday kept its monetary policy steady, as expected, at its regular monthly meeting. The BOE mentioned the very low inflationary environment in Europe as reason for not raising rates.
In other overnight news, Russian president Vladimir Putin is striking a more defiant tone as he feels the bite of Western sanctions and falling crude oil prices. This week the Russian central bank moved to intervene in the foreign exchange market in an effort to support the flagging ruble, which has fallen to a record low versus the U.S. dollar. Reports Thursday said Putin has accused the West of creating the Ukrainian crisis and also warned speculators betting against the ruble. In a speech to Russian government officials Putin reminded everyone of the military strength of Russia.
Traders and investors are awaiting what is arguably the most important U.S. economic data point of the month: Friday’s employment situation report from the U.S. Labor Department. The key non-farm payrolls figure is expected to rise by around 230,000 in November. Any non-farms number that is significantly out of line with expectations will likely at least temporarily rattle the markets.
The London P.M. gold fix was $1,209.00 versus the previous London A.M. fixing of $1,204.00.
Technically, February gold futures prices closed near mid-range. Chart consolidation was featured. Bears still have the overall near-term technical advantage. However, this week’s price action hints of a near-term market low being in place. But the bulls need to show more power soon to suggest a price uptrend can develop. The gold bulls’ next upside near-term price breakout objective is to produce a close above solid technical resistance at this week’s high of $1,221.00. Bears' next near-term downside price breakout objective is closing prices below solid technical support at last week’s low of $1,163.90. First resistance is seen at $1,215.00 and then at $1,221.00. First support is seen at $1,200.00 and then at $1,193.50. Wyckoff’s Market Rating: 3.0
March silver futures prices closed near mid-range. Price action Monday scored a bullish “key reversal” up on the daily bar chart, which suggests the bears have become exhausted and a market bottom is in place. But the bulls still have work to do to suggest prices can sustain a near-term uptrend. The silver bears still have the overall near-term technical advantage. Silver bulls’ next upside price breakout objective is closing prices above solid technical resistance at $17.00 an ounce. The next downside price breakout objective for the bears is closing prices below solid support at last week’s low of $15.41. First resistance is seen at today’s high of $16.68 and then at this week’s high of $16.81. Next support is seen at today’s low of $16.375 and then at $16.235. Wyckoff's Market Rating: 3.0.
March N.Y. copper closed up 440 points at 291.60 cents today. Prices closed nearer the session high on short covering in a bear market. Prices Monday hit a contract and multi-year low. This week’s price action suggests the bears became exhausted at the lower price levels. But right now the bears have the solid near-term technical advantage. Copper bulls' next upside breakout objective is pushing and closing prices above solid technical resistance at 300.00 cents. The next downside price breakout objective for the bears is closing prices below solid technical support at Monday’s contract low of 277.75 cents. First resistance is seen at today’s high of 293.00 cents and then at 295.00 cents. First support is seen at 2.9000 cents and today’s low of then at 286.70 cents. Wyckoff's Market Rating: 2.0.
By Jim Wyckoff


Waiting For Labor
In spite of an assist from a strong euro/weaker dollar, which would push gold prices higher, the yellow precious metal Is down today in regular trading.
It’s not much of a drop, but it is a sign of further uncertainty in gold, as it seeks true direction.
The euro was stronger because the European Central Bank decided to leave interest rates alone, whereas for a few weeks analysts had been expecting a lowering of the basic rate. The ECB, though, is still pondering how and when to buy back toxic or weak paper the way the U.S. Federal Reserve did during its QE3 program.
Again, gold moved in tandem with U.S. equities, a strange coincidence, although the stock markets in New York are only down marginally. Asia was the equities winner today.
We await the employment report Friday for the November jobs picture. The U.S. Labor department will issue the numbers, which seem to be shaping up as “maintaining to positive.” This will help market participants gauge where they believe interest rates from the Fed are headed.
We expect the report to throw some credence into the mix that leans toward the prediction of an uptick in the interest rate.
CNBC put it this way: “A rise in U.S. interest rates would lift the opportunity cost of holding non-yielding gold and further boost the dollar.”
The dollar’s potential rise on the news would, in and of itself, signal lower prices for precious metals since they are dollar-denominated.
Finally, another “outside market” was at work on gold today. Energy commodities prices were down. WTI crude was down almost 1%, Brent down not quite half a point, and natural gas was down a whopping 4+%.
We’re walking on eggshells trying to figure out when volatility in the fundamentals will ease. Until them, we bide our time and look to technical analysis.
Wishing you as always, good trading,
Gary Wagner


Beyond Bernard von NotHaus
Congratulations are in order to United States District Judge Richard Voorhees of North Carolina for the judiciousness of his decision in the case of Bernard von NotHaus. We weren’t personally present at the courthouse at Statesville, where von NotHaus had been ordered to appear Tuesday for sentencing on his conviction of uttering — introducing into circulation — his Liberty Dollars. But we were on tenterhooks, because von NotHaus, 70, was looking at the possibility of spending the rest of his life in prison.
The reason we’ve been watching the case is that von NotHaus’ demarche is one of the few direct challenges to what the Foundation for the Advancement of Monetary Education likes to call “legal tender irredeemable electronic paper ticket money.” That refers to the scrip being issued by the Federal Reserve. Von NotHaus had designed and circulated a medallion made of pure silver, the same specie that was fixed on by the Founders of America as the basis of the constitutional dollar.
A jury found, among other things, that von NotHaus’ Liberty Dollar violated federal law against private coinage and was similar enough to American legal-tender coin that it constituted counterfeiting. “Attempts to undermine the legitimate currency of this country are simply a unique form of domestic terrorism,” the prosecutor, Anne Tompkins, said after von NotHaus was convicted. She suggested that such schemes “represent a clear and present danger to the economic stability of this country.”
In the three and a half years since the jury reached its decision, Judge Voorhees allowed constitutional and procedural objections to be heard but in the end supported the jury. The government on Tuesday asked for a prison sentence of at least 14 years and as much as 17 ½ years. The government was also seeking forfeiture of some 16,000 pounds of Liberty Dollar coins and specie, which in 2011 it had valued at nearly $7 million.
Then spake the judge, sentencing von NotHaus to but six months of home detention, to run concurrently with three years of probation. He departed from non-binding guidelines because, he suggested, von NotHaus had been motivated not by criminal intent but by an intention to make a philosophical point. That is what these columns have been reporting for more than four years, and, while the Sun’s coverage played no part in the case, we are glad to discover that the judge is of a similar, if not identical, mind.
Von NotHaus is no doubt relieved that he doesn’t have to go to jail, but he has put out no statement. Our guess is that it is sinking in on him that he has been marked now as a felon, and his own dream of a parallel form of money, composed of constitutional specie, is gone. There may yet be surprises, but the sagacity of Judge Voorhees’s handling of this case lies in, among other elements, the fact that he has left no great incentive for either side to make an appeal.
Whatever happens, the logic now is for the issues raised in the von NotHaus case to be pursued in the political arena. We are coming up on the 50th anniversary of the Coinage Act of 1965, which stripped silver from our common coinage. President Lyndon Johnson, who signed the bill into law, called it “the first fundamental change in our coinage in 173 years.” He noted that during that nearly two-century span our coinage of dimes, quarters, half dollars, and dollars have contained 90 percent silver.”
“The new dimes and the new quarters will contain no silver,” the president confessed. “They will be composites, with faces of the same alloy used in our 5-cent piece that is bonded to a core of pure copper.” That is how the debasement began, though LBJ did issue a warning. “If anybody has any idea of hoarding our silver coins, let me say this. Treasury has a lot of silver on hand, and it can be, and it will be used to keep the price of silver in line with its value in our present silver coin.”
It was a vain boast. At the time, the value of the dollar was more than two-thirds of an ounce of silver, as it was in 1792. By January 1980, the value of a dollar plunged to less than a 49th of an ounce of silver and even today has regained nowhere near its historic value. It is a shocking abdication by the United States Congress, a point that von NotHaus has thrown into sharper relief than any monetary gadfly has managed to do in years. That is no small achievement.


Gold Market Update
On gold’s 6-month chart we can see how it approached its November lows in the early trade after the Swiss vote, but rallied strongly on big volume to close above its November highs, above the recently failed key support that is now resistance and above its 50-day moving average, which was quite an accomplishment, leaving behind a large “Bullish Engulfing Pattern” on its chart. This points to a probable strong advance dead ahead, so today’s reaction should be used to clear out any short positions, and also to go long aggressively with stops below the November low. This action by gold, and by silver, suggests that the current bull Flag in the dollar, which is getting a bit “long in the tooth”, may be about to abort.Yesterday was an extraordinary day in the Precious Metals markets, with a good chance that it signals the reversal from the brutal 3-year plus bearmarket that so many have waited so long to see. The day started with gold and silver plunging on the news that the Swiss voted against backing their currency with gold, but later in the day they rallied strongly on heavy turnover to close with giant reversal candlesticks on their charts. Regardless of the reasons for this bizarre behavior, technically this action looks very positive, and this is written with the awareness that gold has reacted back this morning on dollar strength.
On the 18-month chart we can see the unusual action in gold since its broke down below the key support level at last year’s lows late in October. After such a breakdown, going on price alone, we would naturally expect to see follow through to the downside, but there was very little reaction before it turned around and took on the support level that had become resistance. It backed off again last Friday and into yesterday morning before the dramatic reversal later in the day which took it back above the resistance. However, around the time gold dropped to new lows, COTs and sentiment indicators were already bullish, as we noted at the time, which made the market very difficult to call, but yesterday’s action was the most bullish we have seen in a long time, so there is a good chance that the bottom is in.
On the long-term 15-year chart we can see that the combination of the failure of support at last year’s lows, and the failure of the long-term uptrend, clearly opened up the risk of a drop back to the strong support in the $1000 zone, although matters were complicated by the already bullish COTs and sentiment, as mentioned above. Now, with yesterday’s bullish price and volume action, the smoke is beginning to clear, and we can see the implications of the bullish COTs and sentiment starting to translate into price and volume action. The result is that it looks like the bottom is in, and that gold won’t drop back as far as $1000 after all. Instead, it could take off higher from here, and given the heavy bearish sentiment that has prevailed of late, it could be a scorcher of a rally with the afterburners full on.
Now we will look at the dollar. Until now we have interpreted the tight sideways pattern in the dollar that has formed in recent weeks as a very bullish “running Flag” so called because it is upwardly skewed which makes it more bullish, which is shown on the 6-month chart below. However, we were also aware that COTs and sentiment for the dollar are already at bearish extremes, so our view was that the dollar would have one last upleg before calling it a day. The implications of the bullish action in gold yesterday are that this won’t happen – instead the dollar Flag will abort and it will break lower, or that if it does advance it won’t be by far. This is certainly a possibility as this Flag is getting “long in the tooth” and the uptrend in the dollar could thus be morphing into a bearish Rising Wedge.
The latest US dollar hedgers chart, which is a form of COT chart, shows readings that well into bearish territory, although they have eased somewhat in recent weeks as the dollar has crept higher.
Click on chart to popup a larger clear version.
Chart courtesy of www.sentimentrader.com
Optimism towards the dollar could scarcely be greater as the following chart for the US dollar optix, or optimism index, makes clear. Readings are in “nosebleed” territory. This may however only call for a significant reaction, not necessarily a bearmarket. It is worth noting that the dollar index is close to resistance at its 2009 and 2010 peaks.
Click on chart to popup a larger clear version.
Chart courtesy of www.sentimentrader.com
What about Precious Metals stocks? At first sight their charts don’t exactly look great, even though they have been outperforming gold in recent weeks, which is a positive sign in itself. On the 5-year chart for the HUI index, we can see its horrible long downtrend from 2011 – 2012 and how it still appears to be on the defensive, with moving averages in bearish alignment and zones of resistance overhead. However, with gold and silver suddenly looking a lot better, there should be some evidence of a potential trend change visible, and there is. Assuming the recent low holds, there is a marked convergence of the downtrend, which makes it a bullish Falling Wedge, and clearly it will be an important positive development when this index breaks out first above the nearby resistance shown and then out from the downtrend a little further above.
While the chart for the HUI index, which does not show volume, is not particularly encouraging, the same is not true of the chart for the Market Vectors Junior Gold Miners, code GDXJ. The 5-year chart for GDXJ shows that volume has built up steadily over the past year to arrive at tremendous climactic levels. The is definitely a sign that we are at a bottom, or close to it, since only fools sell at such low levels with such huge losses, and somebody is taking the other side of the trade, that somebody being Smart Money. The immense volume makes it all the more bullish, as it is shows rapid rotation of stock from weak to strong hands. We picked up on this earlier this year, and thought that the bottom might be in, but it has got even more extreme with the recent new lows.
Supporting the contention that the sector is bottoming is the Gold Miners Bullish Percent Index, which actually hit zero some weeks back at the recent low after the breakdown, but has now clawed its way back up to the still dismal reading of 6.67% bullish. There is obviously plenty of room for improvement here – and plenty of scope for a sector rally.
Turning now to the latest COTs we see that, while they are not as bullish as they could be, the readings are still on the bullish side, and we should bear in mind that last week’s uptick in Commercial short and Large Spec long positions preceded the sharp drop on Friday and into Monday morning, so it will be interesting to see how the COTs look after yesterday’s sudden recovery when they are released on Friday.
Click on chart to popup a larger clear version.
The Gold Hedgers chart shown below, which goes all the way back to 2008 and is another form of COT chart, makes clear that historically, readings are quite strongly bullish now.
Click on chart to popup a larger clear version.
Chart courtesy of www.sentimentrader.com
The latest Gold Optimism chart, or Optix, is strongly bullish as it shows that extreme pessimism still prevails towards gold, which is of course exactly what you want to see at or close to a market bottom…
Click on chart to popup a larger clear version.
Chart courtesy of www.sentimentrader.com
The Rydex Traders continue to maintain their fine and long-standing tradition of being a contrary indicator. Their holdings in the Precious Metals sector are near record lows, which has got to be bullish.
Click on chart to popup a larger clear version.
Chart courtesy of www.sentimentrader.com
According to the long-term XAU index over Gold chart, the sector is even more attractive than it was back in 2000 before the start of the bullmarket, because stocks have become so undervalued relative to gold – much more so than at the depths of the 2008 market crash and more still than in 2000. The rationale behind this is that when investors are fearful towards the sector, they favor bullion over stocks, as they know that bullion will always have value, whereas stocks can go to zero. What this chart shows is that right now they are more fearful towards the sector than they have ever been, and on a contrarian basis that is very bullish.
End of update.


Jordan Roy-Byrne Believes 2015 Will See the Renewal of Gold's Secular Bull Market
Source: Kevin Michael Grace of The Gold Report (12/1/14)
Past performance does not guarantee future performance, as they say, but Jordan Roy-Byrne, CMT, editor and publisher of The Daily Gold Premium, is persuaded that the bottom in gold is no more than a couple of months away. And after that, look out. In this interview with The Gold Report, Roy-Byrne says that his study of gold's history explains why gold could retest $1,900 per ounce by the end of 2016 before going parabolic.
Jordan Roy-Byrne: I do not think we have seen the bottom, but I think we are very close. It should happen within the next couple of months.
TGR: Why do you think we're so close?
JRB: Typically, markets don't bottom at random numbers. Gold has really strong support at $1,080/oz, which is the 50% retracement of the entire bull market, and at $1,000/oz, which is the key psychological level and also was a key support level in 2008–2010, so gold is more likely to test those levels than bottom at $1,137/oz.
Two more reasons to believe we haven't hit bottom are volatility and the Commitment of Traders' (COT) report. The two biggest volatility spikes in the last six years were at the 2008 bottom and then at the 2011 top. In the last month or so, volatility has picked up after being absent for most of 2014. Gold's trend is down, so increasing volatility suggests a sharp selloff that could take gold below $1,100/oz. A spike in volatility combined with major support at $1,000/oz is one recipe for a major reversal.
"Balmoral Resources Corp. has a great gold deposit, Martiniere, in a great jurisdiction, Quebec."
The COT report, which tracks futures traders, suggests that we have not hit an extreme, but again it's very close. A decline below $1,100/oz or $1,080/oz would likely result in many traders panicking out of the market and at the same time putting on more short positions. Given the current construction of the COT, a decline below $1,100/oz in gold would result in the net speculative position and gross short positions reaching 13-year extremes.
TGR: An alternative explanation for the fall in the gold price is aggressive shorting by institutions such as Goldman Sachs, perhaps aided and abetted by central banks. What do you think of that?
JRB: I don't think anything of it. Yes, short positions have increased, but this is how futures markets work. It's just sour grapes.
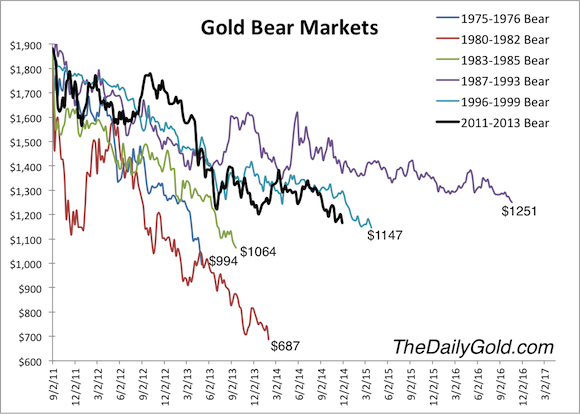
TGR: Talk about your bear analog for gold and what it tells us.
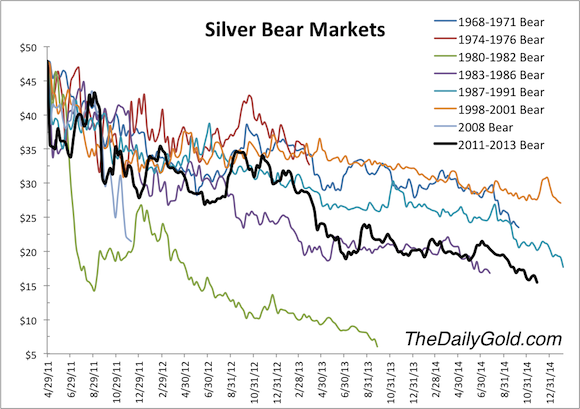
JRB: I'll talk about that but also about my analogs for silver and mining stocks. These analogs examine the historic bear markets and plot them on graphs in order to compare them. We must remember that bear markets are a function of price and time. And those with the sharpest declines last the shortest amount of time. The gold and silver crashes in the 1980s lasted less than two years. They were spectacular declines with most of the damage done quickly. But bear markets that last for years are not particularly severe in terms of price.
TGR: What do your analogs tell us about silver and mining stock bear markets?

JRB: Most bear markets in mining stocks average about a 65% decline. What we've seen in the current bear market is well in line with history. Silver bear market declines are typically 50–70%.
TGR: So the ongoing bear markets in gold, silver and mining stocks are historically typical?

JRB: The current bear markets have lasted a little over 3 years for gold and over 3.5 years for silver and mining stocks. They've been fairly severe in terms of time and price but not extreme. Keep in mind that gold went from $250/oz to almost $2,000/oz and silver from less than $4/oz to $50/oz. Those were spectacular moves.
That said, the entire bear market is more severe than what one would have expected. The reason is that we had a very strong advance in 2001–2011, with only a mini-bear market lasting six months in 2008.
TGR: What about the possibility that the current bear markets will break through historic precedents?
JRB: It's always possible. It remains my belief, however, that gold could fall another $200/oz to tick below $1,000/oz and fool people that we are still in the thick of the bear market, when we have actually come to the end. Now, if we don't have a bottom by the middle of next year, and gold is lagging under $1,000/oz, your question will be more pressing.
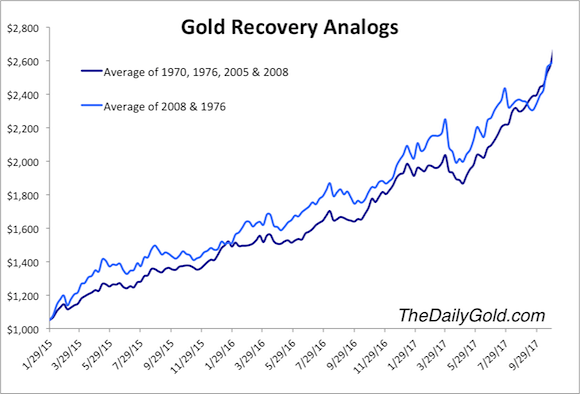
TGR: You also have a gold recovery analog. What does this suggest with regard to how high gold will rise with the next bull market?

JRB: This analog examines the strongest historic cyclical moves in gold and applies them forward. My chart begins with a $1,050/oz bottom at the end of January 2015. I've merged the recoveries of 1970, 1976, 2005 and 2008 into one average and the two strongest recoveries, 1976 and 2008, into another.
These data suggest that gold should hit $1,500/oz within 12 months from the bottom. If gold does bottom in the next four months, the analog presents a very strong case that gold will retest $1,900/oz by the end of 2016.
TGR: The analog also suggests a high above $2,600/oz by September 2017. That would be an all-time, inflation-adjusted high, correct?
JRB: Correct. If gold tops $1,900/oz again, one would expect greater moves and increased volatility after that. The recovery analogs suggest that gold could start to go parabolic around $3,000/oz. How high would it go? I think $5,000–10,000/oz by maybe 2019 or 2020.
TGR: Hundreds of precious metals equities have reached 52-week lows since October. Given your forecast about the near-term bottom, is today a good day for investors to buy these stocks?
JRB: I would say no because should gold fall below $1,100/oz, there will be a final cleanout, and only then will that space be fully derisked. Over the last 18 months or so, I have been fooled several times in believing that gold stocks had been so oversold they couldn't go any lower. While they rebounded strongly for several months, they ultimately went lower.
Gold has always been the real driver of this bear market in precious metals equities, so I don't want to buy the equities until we see the final move down in gold. The bear market is mostly over. The risk/reward ratio is generally excellent now, but I think we could have a little bit more pain. And, of course, investors must choose companies carefully because these precious metals equities are all over the map.
TGR: After we've bottomed out, and market interest returns, what should investors look for in gold producers?
JRB: Number one is production growth potential and the financial position to ensure that growth. Look at companies with mines producing close to or above 100,000 oz (100 Koz) per year and mines that are early in their lives. Also, consider companies that are barely profitable right now. At $1,500/oz gold, barely profitable becomes strongly profitable. That change in margin is huge for the stock price. These are the factors that could drive the best share performance. Investors should also look for companies in the best jurisdictions because they're the best takeover targets.
TGR: What should investors be looking for in exploration and development companies?
JRB: Experienced management teams that have built mines before or sold them before or have track records of success in discovery and exploration. Their companies should have several-million-ounce deposits in good jurisdictions, deposits than can support mines at 100 Koz per year or more. Companies with smaller deposits should be avoided because such deposits will require these companies to build the mines themselves, which is really tough.
TGR: Which jurisdictions are best?
JRB: Canada, Nevada, Mexico and West Africa. This is where the majors are. And majors with operations in Nevada or Mexico, for example, will want to make acquisitions there. They don't want to build big new camps somewhere else.
TGR: How low should the all-in gold production costs of these development companies be?
JRB: Companies with deposits that require a gold price of $1,500/oz to be profitable are just too high risk. Should gold fall to $1,000/oz, these companies can fall to $0.01 a share or trade at their cash value.
Their deposits should make good money at $1,200–1,300/oz and have internal rates of return (IRRs) of at least 20% after tax. Deposits like these have the best risk/reward ratio and good leverage. And should gold rise to $1,400–1,500/oz in the next year, these companies can make really, really good money. Best of all are companies with advanced projects that have multimillion-ounce deposits that are low cost and fully financed.
TGR: Can you give an example of one such company?
JRB: Obviously, there are very few such companies out there, but one example is Guyana Goldfields Inc. (GUY:TSX) and its Aurora gold project. Aurora will produce 194 Koz per year for 17 years. Its initial capital expenditure is only $249 million ($249M). It has an after-tax IRR of 31% and an after-tax net present value of $735M. It has solid growth potential as well. Aurora's Proven and Probable resource is 3.48 million ounce (3.48 Moz) gold, while its Measured and Indicated resource is 6.54 Moz, with 1.82 Moz Inferred.
Construction is underway, with production scheduled for mid-2015. Production cash cost is $527/oz gold, so it can make good money at $1,000/oz gold. It is a surefire takeover candidate at some point. Companies like this are the stocks you want to watch very closely because if we see that final decline before the bottom, you can buy them at better prices then if you bought them right now or at $1,300/oz gold.
TGR: What other type of explorer/developer are you keen on?
JRB: Companies with multiple deposits. I'll name two. The first is Balmoral Resources Ltd. (BAR:TSX; BAMLF:OTCQX). Its stock has been a very strong performer recently. It has a great gold deposit, Martiniere, in a great jurisdiction, Quebec. Balmoral's value driver is its nickel-PGM discovery, Grasset, which has had some great results, including 1.85% nickel, 0.21% copper, 0.4 g/t platinum and 0.97 g/t palladium over 57.9 meters, announced Nov. 26. So Balmoral has two deposits, and it could spinoff Grasset into a new company if it wants or sell it and use that cash to really drill out Martiniere.
The company did a $10M financing this month. It is cashed up and has great management. Darin Wagner, the CEO, and his team are winners, and they know where to drill as evidenced by two tremendous discoveries.
TGR: What's the second?
JRB: That would be Cayden Resources Inc. (CYD:TSX.V; CDKNF:OTCQX), which was just taken out by Agnico Eagle Mines Ltd. (AEM:TSX; AEM:NYSE). Cayden had two value drivers in Mexico, Las Calles, which is something that Goldcorp Inc. (G:TSX; GG:NYSE) needs, and Morelos Sur, which has put out some great results. Even before the takeover, Cayden was a strong performer that held up really well during corrections.
TGR: Some shareholders in Cayden were disappointed because they thought the sale price of $205M was less than it was worth.
JRB: Over time, with a higher gold price and more drilling it would have been worth more. Today, it seems like a really good deal.
TGR: Besides taking out Cayden, Agnico has also, with Yamana Gold Inc. (YRI:TSX; AUY:NYSE; YAU:LSE), bought Osisko Gold. Has Agnico played a smart takeover game?
JRB: Agnico is very aggressive. Its stock was doing really well when things were booming. I think Agnico has done a good job making small investments in juniors and is well positioned for the future, assuming a big recovery. I was a little surprised by the Cayden buyout, but Cayden has really good grades in a top jurisdiction. I think Cayden is something of a one-off.
TGR: Which companies will lead the next wave of mergers and acquisitions (M&As)?
JRB: First off, I don't see a lot of M&As until we get a confirmed bottom in gold, when it rises above $1,300/oz, perhaps. That's what will persuade the majors that the bottom is in. At that time, their financials will be picking up, and that's when they can pick off some of the best assets. Maybe late 2015. Right now, most companies are trying to make sure they survive if gold goes below $1,100/oz.
TGR: What about the prospect of proactive takeovers by companies confident enough in gold's future to save $100M or $200M by acting now rather than waiting?
JRB: One possibility for that is Randgold Resources Ltd. (GOLD:NASDAQ; RRS:LSE). It has no debt and has been the best large gold miner over the last decade. Randgold has four producing mines and $500–700M in capital available to make acquisitions. There are many excellent targets in West Africa, so long as the Ebola situation doesn't spiral out of control there.
Another possibility, this one on the royalty/streaming side, is Franco-Nevada Corp. (FNV:TSX; FNV:NYSE). The company is so well capitalized and has been making a ton of deals over the last 12–18 months. Franco is making money and adding more streams and attributable production. Its stock has held up really well in a difficult time.
TGR: With Franco buying all these streams, it's building in a lot of leverage to a high gold price, correct?
JRB: Absolutely. The one thing with Franco is that it tends to outperform at the very end of bear markets and then at the beginning of bull markets. This is a stock that should continue to perform really well, and if gold goes up, as I believe it will, it will benefit greatly, as will its partner companies. A higher gold price means that Franco won't have to worry about its partners getting into trouble.
TGR: Is there any particular event that investors should look for in the next couple of months to demonstrate that the worm has turned and that we're definitely into another bull market?
JRB: One thing investors should follow is the gold/S&P 500 ratio. Over the last 3.5 years there's been a severe negative correlation between these two asset classes. Money has for years flooded into the broader equities markets but not into precious metals. Right now, money is still flooding into equities generally but is exiting gold.
I think it's possible over the next couple of months we could see a potential blow-off move in the S&P 500. And if the gold/S&P 500 ratio rebounds significantly thereafter, that would be quite a signal. Another event would be gold falling to $1,000/oz and then making a monthly close above $1,200/oz. That would demonstrate to me that we're in a new bull market.
TGR: Jordan, thank you for your time and your insights.
Subscribe to:
Posts
(
Atom
)