What’s In Store For Gold in 2015?
The following article is from Gold Stock Bull contributor,
Ben Kramer-Miller. While I agree with his overall assessment and
reasoning, I am a bit more bullish in the short term and think precious
metals have likely already found a bottom. Of course, short-term pricing
is driven by paper derivative contracts and the emotions of investors
that either panic or buy the dip when the sharp price movements occur,
so anything is possible in the short term. In the medium to long-term,
we both agree that prices for both gold and silver are moving
substantially higher and that 2015 will prove to be an excellent year to
accumulate metals and undervalued miners. Cheers – Jason Hamlin
Overview
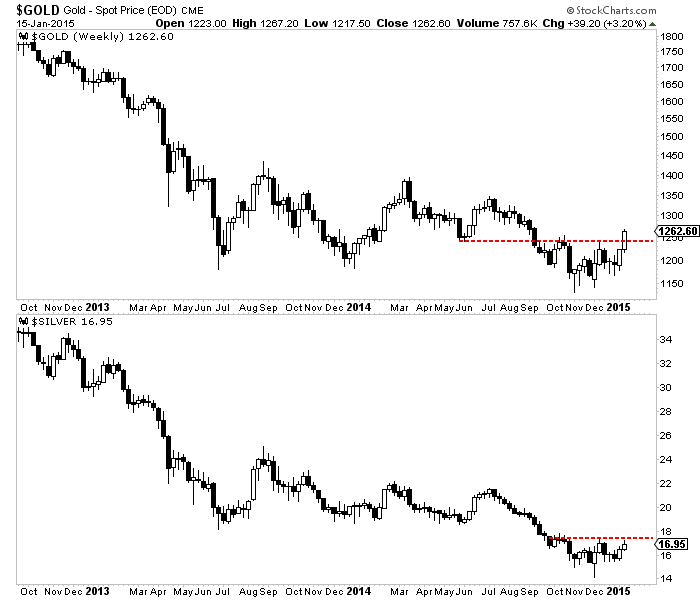
After a lousy 2013 gold was essentially flat in 2014. The London AM
fix on December 31st came in at $1,199.25 in 2014 vs. $1,201.50 for
2013.

The year started out strong and many gold bulls called the end of the
downtrend. However a strengthening US Dollar, signs of economic growth
in the US, and concerns over the Fed’s tapering program put an end to
the bull market pretty early in the year when gold peaked in March at
~$1,370/oz.
These signs, among others (which I will discuss in a moment),
prompted me to
call for more downside in the gold market in September when the price
was hovering around $1,300/oz. Shortly thereafter the gold price fell
below its critical support level of ~$1,180/oz. and traded down to
~$1,135/oz. before rebounding back to today’s range, which is roughly
$1,180 – $1,220/oz.
So where do we go from here?
As a gold bull I want to believe that gold is going to start moving
higher from here, but unfortunately I think the odds remain stacked
against this, and that we will see further downside before the bull
market resumes. I will first go through the reasons why I think this is
the case and I will then discuss how to play this.
Why Gold Probably Has More Downside
Again I discussed some of the reasons I think gold has more downside
in the near term in September. It is worth repeating/updating a couple
of these reasons, and I also want to bring a couple others into the mix.
1-Gold Didn’t Test Its 2009 Breakout Point
Gold has experienced two significant corrections since the bull
market began at the turn of the century. The first was in 2008 and the
second began in 2011. One thing that differs between the two besides
their durations is that when the market bottomed in 2008 it hit a major
support level of ~$700/oz. This level is technically significant because
it had previously been resistance from April, 2006 through August,
2007. But we have not seen gold test its previous breakout point in this
downtrend. The last breakout point was the resistance level of
~$1,000/oz., which is where the market peaked in 2008. The breakout led
to the subsequent rally all the way to ~$1,900/oz. in 2011. Now if the
pattern were going to repeat the gold market should test the $1,000/oz.
level, but as you can see on the following 10-year chart of the SPDR
Gold Trust (NYSEARCA:
GLD) we haven’t seen this.

Technical analysts would argue that a test or even a quick breach of
the $1,000/oz. level (or ~$95/share for the GLD) would wipe out the
speculative money that entered the market after the gold price broke to
its new all-time high, and that this would be needed in order to set the
stage for a fundamentally driven leg higher.
2-Stocks and Bonds Remain In Favor
Broadly speaking I am not bullish of stocks, and I am downright
bearish of bonds. But there is no denying that these assets have been
performing well over the short and intermediate term. While the
mainstream financial press would have you believe that these assets
trade opposite to one another they are historically correlated, and
pertinent to this discussion they are negatively correlated to gold.
Stocks and bonds are both financial assets, meaning that they are
claims against another entity that owes something to the stock or bond
holder (e.g. dividends or interest payments). Despite the fact that
stocks and bonds are richly valued on an historic basis investors don’t
seem to care. Easy credit from the Fed makes these low returns appealing
on a relative basis, and this puts pressure on assets whose value is
intrinsic such as gold and other commodities.
At least in the near term bonds will remain expensive because central
banks will see to it that interest rates remain low, and stocks respond
to this as low bond yields make stock dividend and earnings yields more
attractive by comparison.
With financial assets in favor real assets are, by extension, out of
favor. Commodities in general–not just gold and precious metals–have
been weak with very few exceptions.
Now financial assets are, broadly speaking, overvalued while
commodities are generally undervalued, and this includes gold. But the
market is not at a point where these disparities really matter. So long
as money remains cheap bond prices can rise and anything that has a
yield can rise with them. At some point this situation will reverse
itself, but for now it suffices to say that it makes sense to yield to
Newton’s first law of motion, and acknowledge that financial assets will
keep rising while tangible assets will keep falling until something
happens to reverse this trend.
3-Federal Reserve Tapering and Rising Interest Rates Are Perceived To Be Bearish for Gold
This follows from the misconception that I just discussed. Many
investors are concerned that the Fed has stopped pumping money into the
market via its QE program, and that this is bearish for gold. The
intuition is that there will be less money in the financial system to
bid up gold prices.
The fact is that if the Fed raises rates there may very well be less
money in the system. And this perception has the potential to drive some
naive investors out of the gold market and some speculators to short
the market.
We’ve seen, however, that this is misguided and we will shortly see just how misguided this actually is.
4-The Dollar Index Has Been Strengthening
One of the big surprises this year has been the strength in the
Dollar Index, as you can see on the following chart. courtesy of
Barchart.com.

This strength has led investors to believe that the Dollar itself is
strong, and it leads investors to avoid investments in gold and in other
commodities.
Now gold bulls know that Dollar Index strength is not the same thing
as Dollar strength. The former simply means that the Dollar is
increasing in value relative to a basket of currencies that includes the
Euro, the Yen, the Pound, and others. But this doesn’t mean the Dollar
itself is strong. For instance, the Dollar Index has gained about 15%
since its 2008 low, but the Dollar has lost about a fifth of its value
relative to gold.
Nevertheless in the short run this perception can trump reality, and a rising Dollar Index can be short-term bearish for gold.
The Bullish Perspective: Rising Rates Will Send Gold Soaring
A novice view of the phenomena just discussed paints a very bearish picture for the gold market.
But a deeper analysis of these phenomena–particularly the second and the third–paints an extremely bullish picture.
We saw earlier that QE and ZIRP has created demand for bonds and
stocks because even their paltry interest rates are attractive in the
context of very low interest rates available on cash/equivalents while
there is more money in the financial system to bid these assets higher.
This takes away money from the gold market which doesn’t generate any
income.
While this line of reasoning makes sense unto itself I think a lot of
investors are confused in the sense that quantitative easing and ZIRP
(i.e. zero interest rate policy) have not pushed gold higher. Shouldn’t a
rising money supply have precisely this effect?
In spite of this intuition the above line of reasoning holds and
historically the gold price has performed best when the Fed’s benchmark
rate has been trending upward. I discussed this at length in
another article and I have imported the following chart for the reader’s convenience.

Investors who don’t understand the logic behind the obvious
correlation here should think of it as follows. Low interest rates and a
rising money supply are bullish for gold in the same way that pushing a
beach ball under water is “bullish” for the beach ball in the sense
that when the pressure is lifted the beach ball will fly higher than it
would have otherwise. To put it another way low interest rates are
bullish for gold in that they give it potential energy, but kinetic
energy will send it higher, and it will take rising rates to convert
this kinetic energy into potential energy.
With that being said gold I think it is important to point out that
gold is being infused with an unprecedented amount of “potential energy”
in the sense that never in this history of the Federal Reserve has the
monetary base risen so rapidly. We can see in the following chart that
the monetary base has risen 5-fold (17% per year) in the past 10 years.

Gold doesn’t necessarily trade with the monetary base but we can use
it to get a good idea of gold’s relative valuation by looking at the
value of America’s gold relative to it.

We can see that using this metric not only is gold undervalued, but
it is more undervalued than it has been since 1918, which is as far back
as the Fed’s monetary base data goes. We can also see that in spite of
the fact that the gold market traded to a nominal record high in 2011
that it has–from at least one perspective–been in a bear market for the
past 35 years.
What Will Signal The Turnaround?
So gold is incredibly undervalued and is perhaps in a multi-decade
long bear market. Why should the downtrend end anytime soon, and what
should we look for as a signal that the bear market is actually coming
to an end?
We’ve already seen the answer to this above–rising rates. The Fed has
signaled that it will raise its benchmark interest rate starting this
year for the first time since 2008, and we’ve seen that this will make
bonds and stocks less attractive on a relative basis, and some of this
“excess” money will find its way into gold.
So one scenario is that the Fed increases rates, the gold market has a
knee-jerk reaction to a new low as pundits ramble on about how negative
this is for gold, and then the market reverses sharply from its new low
and begins a new uptrend.
There is a problem with this scenario, however. Every time the Fed
has removed stimulus from the market the stock market has fallen and it
begins a new “panic,” which in turn gives the Fed an excuse to continue
with more stimulus.
I think we can still see gold rise in this scenario because interest
rates can only go so low and bond/stock yields can only go so low as
well. Already bond and stock yields are at historic lows, and while the
can go lower eventually their overvaluations will get the best of them
and we can see money enter the gold market. One might argue that we may
already be on the verge of this given some signs such as the downturn in
junk bonds (see the following chart of the iShares High Yield Debt ETF
(NYSEARCA:
HYG) and the uptrend we’ve seen in volatility. Both charts are courtesy of Stockcharts.


But in this case what sort of signal should we look for? that the gold market has turned?
In this scenario I think investors should look at Gold Forward
Offered Rates (GOFO). This is the rate at which bullion banks lend gold.
The lower the rate the more desirable it is for banks to hold gold.
But what specifically should we look for, and how does this tie in with the current scenario?
A lot of investors suggested recently that the fact that the GOFO
rate went negative towards the end of 2014 that the gold market had
likely bottomed. I think this is misleading considering the current low
interest rate environment that we are experiencing, and this point is
supported by the fact that GOFO went negative in 2013 and this didn’t
signal a bottom in the gold market.
What we need to see, therefore, is for bullion banks to value gold
substantially more than they value interest-bearing paper assets, and so
I think the signal to look for will be relative GOFO rates. This is a
data point that is measured via LIBOR minus GOFO. If this rises
substantially it means that investment banks would much rather hold gold
than interest bearing assets as short term interest bearing assets are
correlated at least in part to LIBOR rates.
When we back-test this thesis we can see that spikes in 1-month LIBOR
minus GOFO have been predictive of new uptrends in the gold price.

Each major spike has corresponded with a buy signal in the gold
market. Now if we zoom in on the past couple of years we can see some
mini-spikes, but nothing resembling the 1999, 2001, and 2008 spikes
pictured above.


 19:47
19:47
 Unknown


