Monday, 26 January 2015

Gold Price Model Says Gold Still Undervalued

Gold hit a price low of approximately $1,140 in early November 2014. Since then it has rallied dramatically, possibly because of global fears about the financial system, the Swiss National Bank removing its peg to the Euro, more QE, escalating war in the Ukraine, or simply that gold prices were over-extended and ready to rally.
In my opinion gold reached an important low in November, and in spite of a rising dollar, has rallied since then in dollar terms, and even more in most other fiat currencies.
However gold is still undervalued by about 16% according to my long-term empirical model. Further, gold has potential to rally far higher and is likely to overshoot the 2014 equilibrium price of $1,527 calculated by the gold model.  Gold could easily reach $2,000 by late 2015 or 2016.
Examine the graph of annual gold prices since 1971 versus the calculated gold prices from the empirical model.  The correlation, as calculated by Excel, is 0.98 for 1971 – 2014.
Gold Calculated Per Model
My empirical model begins in 1971 when President Nixon “temporarily closed the gold window,” allowed the dollar to float freely, and enabled currency in circulation to increase rapidly. The model uses only three macro-economic variables, which are discussed in detail in my book, “Gold Value and Gold Prices From 1971 – 2021”.

What does the model indicate for the next several years?


Since the model is based on two dominant variables and one minor variable we can ask how those two dominant variables are likely to change in the future. National debt is the first variable and has increased since 1913 at about 9% per year. Since 2008 it has risen approximately 10.0% per year. Based on one hundred years of history and current politics, we can safely assume that the U.S. national debt will continue rising, and that expenses for the United States government will substantially exceed revenues for the foreseeable future.
The second variable is the price of crude oil which has fallen dramatically in the last 5 months. Many people have suggested that the price of crude will remain low for the balance of the decade and perhaps far longer because of weakening demand. While I understand the weak demand argument, I believe that the price of crude will erratically rise along with total currency in circulation and total debt, as it has since 1971.
Central banks will use their primary tools – monetizing bonds or “printing money” – to overcome deflationary influences in the global economic system. Japan has given us an indication of what to expect from central banks in Europe, the United States and Great Britain. In my opinion the current low price of crude, whether due to diminishing demand or price manipulation, is temporary and will increase considerably due to the inevitable rise in global debt and currency in circulation.
The two variables, debt and crude oil, will dominate in the calculation for future gold prices.  My conclusion is that gold is still undervalued and that my model projects substantially higher prices for gold through the balance of the decade. The model uses plausible assumptions about increasing debt and the price of crude oil over the next six years and indicates that $5,000 gold and possibly $10,000 gold are reasonable and should be expected.  Please note that certain events, such as hyperinflation in the United States, a nuclear war, or even a widening Ukrainian war could easily push the price of gold (in U. S. dollars) far higher than the model indicates.
If central banks fail in their efforts to increase inflation, and the world devolves into a global deflationary depression and possibly a nuclear winter, the dollar price of gold could be unpredictable, but the purchasing power of gold will almost certainly increase as paper assets and fiat currencies crash and burn in a deflationary depression.
In my opinion the deflationary depression scenario seems far less likely given that central banks have a one hundred year history demonstrating both their willingness and ability to devalue their currencies, create inflation, and to drastically increase the total debt and currency in circulation.

Conclusions:


The price of gold closed on Friday, January 16 at approximately $1,276. My model indicates that price is still too low by about 16% and therefore the probability is that the price of gold will rally substantially in the next several years.

Tuesday, 20 January 2015

A Mine is a Terrible Thing to Waste

Bob Moriarty

I was on the way to the field last week when the news came out about the surprise Swiss move to sever the tie with the price of the Euro. I suspect that move will be identified as the beginning of the end. In a matter of minutes, the value of the Swiss Franc rocketed higher by 30%. Other than perhaps Zimbabwe, I don’t think I have ever heard of any currency changing value by 30% in minutes. The Swiss Franc settled up some 15% for the day.
Many years ago I wrote a short piece when Enron collapsed I called “The End of the World. . . as we know it.” In it I bemoaned the danger inherent in having the incredible sum of $100 trillion in derivatives. Boy did I get it wrong. Derivatives made it as high as $710 trillion and now stand at a still incredible $691.492 trillion dollars. When that firecracker goes bang, it will rattle the windows in the houses on Orion’s Belt. We have a world economy of under $70 trillion, derivatives are a ticking time bomb and one went off last week.
According to the BIS, the derivatives on the Swiss Franc totaled $3.95 trillion in the last reporting period. A 30% loss would cost some poor sods $1.185 trillion, 15% loss would be a still hefty near $600 billion. Hedge funds are starting to pop like an overheated bag of popcorn. This could be the end.
It came to me that perhaps an investment  in silver and gold might not be amiss according to Exter’s Triangle. I recognized as early as 2002 that governments would attempt to fiddle with the economy when derivatives blew up. I also understood they are powerless.
The project I was going to see used to be the 2nd largest silver mine in Arizona. From discovery in 1892 until WW II caused the mine to shutter in 1942, the Commonwealth Silver mine produced about 16 million ounces of silver and 138,000 ounces of gold. The silver mines around Tombstone produced more silver however; we will have a drill rig on the ground of the White House before anyone allows mining in Tombstone.
Management of the privately held Commonwealth Silver and Gold optioned the Commonwealth Mine in late 2010 from another private company. They completed the purchase in 2011 right as silver topped. Actually their timing couldn’t have been any better, they were able to raise $9.5 million at the top and have watched as their brethren silver companies cratered as silver dropped over 70%. They came close to going public several times but the market wasn’t right. Meanwhile they did put the money raised into the ground.
The company filed an updated 43-101 and PEA study in April of 2014. It shows 389,000 ounce of gold and 32 million ounces of silver in M&I and an additional 67,900 ounces of gold and 4 million ounces of silver in the inferred category with about 1.05 million ounces of gold equivalent in total. At $1350 gold and $25 silver the project showed a blistering 58% IRR at a 5% discount rate and NPV of over $101 million. Capex would require about $27 million to production.
The numbers in the PEA are a bit optimistic for today’s prices but given the crash in energy prices, actually the NPV and IRR would be a lot higher today.
A mine is a terrible thing to waste and this mine will be back in production. It’s gone through several owners since closing in 1942 and come close to production several times. With current management in place, it will go public with more favorable prices. The management team has expanded the footprint of the project and believes the mine has district potential. Since the existing mine is on patented ground, permitting could be done in as little as two years. With more time and more drilling, the resource could be expanded and more ground permitted for mining on the surrounding BLM ground.

Gold's New Friend: The Swiss Franc!


  1. While I predicted a huge rally in gold would usher in the new year of 2015 in a spectacular way, the top bank economists have failed again.

  2. Most of them predicted, “No rally for gold!” Their dire predictions in 2014 all failed to materialize, and this year they are off to an even worse start.

  3. The bank economists, quite frankly, look ridiculous. They clearly need to reset their thinking about the powerful demand coming from billions of Chinese and Indian citizens, or they risk turning themselves into clownish figurines.

  4. The daily chart for gold looks spectacular. Please . Note all the buy-side support lines that I’ve highlighted on this chart.

  5. For another look at that daily chart, please . Note the green trend line. The breakout above that line will attract a large number of technicians and momentum-oriented hedge funds.

  6. The commercial traders are shorting gold into this strength, but I suspect they may end up booking heavy losses on this trade. They don’t lose often, but they appear to be in some serious trouble here.

  7. Please. Chinese hedge funds have emerged as a new potential threat, to the Western bank dominance of the world’s metals markets.

  8. It’s impossible to know if these giant Chinese funds are running long gold/short copper trades of size. If they are, the Western banks may decide to fold on their short gold positions, rather than risk even bigger losses.

Gold Market Update

originally published 
 
Nothing has been done to address the structural inadequecies and distortions that lead to the 2008 financial crisis – instead our leaders have resorted to the procrastination made possible by turning to drugs, specifically Quantitative Easing, which has enabled them to clamp interest rates at 0 to prevent the already unserviceable debt load from compounding out of sight. Spearheaded by the US, this money printing policy has now become standard practice around the world, with Europe and Japan following suit in a big way. The notion put about that all this newly printed money can somehow be contained within banks is nonsense as demonstrated by the soaring prices of stockmarkets in developing markets until recently and in various asset bubbles like the boiling London and New York Real Estate markets.
This global procrastination worked until recently, but now this reckless and economically suicidal policy is visibly coming apart at the seams – it didn’t work for Robert Mugabe’s Zimbabwe and it won’t for anyone else either because it is a flawed scheme to avoid facing up to the consequences and fallout from one’s actions. The only reason that the ship hasn’t sunk so far is complex financial engineering that has enabled the rot at the heart of the system to be obfuscated for as long as possible, but now the markets have gotten control of the ball and things look set to get ugly fast.
Of course, no-one really wants them to grasp the nettle and seriously attempt to rectify the mistakes of the past, because they have left it so late to do this that it would lead to an earth shaking deflationary implosion that would economically lay waste most of the planet. This being so they have no choice but to continue with more of the same, and any attempt by the Fed to resist the inevitable QE4 will lead to the markets getting it in an arm lock and forcing it to comply and cough up. This process has already started as deflationary forces have been gaining ascendency. A symptom of these gathering deflationary forces is the crash in  and the failure of key support in copper about a week ago, which threatens to crash too unless something is done. The big question is when will they (the Fed) capitulate and reverse course – will they do so immediately to keep the game in play, or will they let the US stockmarkets crash first, so that they can use it as a justification for their actions? Europe, which is already being ravaged by deflation, has already surrendered and is preparing to do massive QE, which is why the euro is so weak.
Last week we had the bombshell development of the Swiss abandoning their Franc peg to the euro. This was a development with grave implications. They know that this move will severely damage their exports and tourism industries, but they have done it because they realize that it is better to take to the lifeboats now than go down with the Titanic (the euro). This was a major vote of no confidence in the euro that has kicked out an important prop from under it – and it's nice to see the Swiss going back to their independent mountain ways – now all they have to do is kick out the international snoopers spying on bank accounts to restore the confidence of the global tax dodging community.

Gold & Silver Trading Alert
Dollar’s Major Breakout and Gold’s Simultaneous Rally

Przemyslaw Radomski

Briefly: In our opinion no speculative positions are currently justified from the risk/reward perspective. Being on the long side of the precious metals market with half of the long-term investment capital seems justified from the risk/reward perspective.
Gold soared on Friday once again and so did the USD Index. It was yet another day of the two rallying together, which is a very bullish development. What’s next?
We generally don’t post alerts when the markets are closed, but we decided to update you this time anyway, as quite a lot happened last week and we thought that posting a comment today would be useful to you.
The medium-term outlook has improved greatly, but not based on what most market participants (individual investors, mutual- and gold hedge funds, etc.) think. The most recent move higher is not what improved it – we have already seen significant – yet counter-trend – rallies in the past years, which didn’t change the medium-term trend, so why should this one be any different? The real difference comes from the situation in the gold-USD link and the gold link to the bond market. Let’s start today’s alert with the USD Index (charts courtesy of http://stockcharts.com).
The USD Index moved and – more importantly – closed the week above the resistance level. We have just seen a breakout.
The USD Index had been trading below the resistance for some time and it paused at the cyclical turning point. Perhaps the pause was the effect that the turning point had – the trend might have been too strong for this signal to generate a decline.
The breakout has not yet been verified, but a weekly close above the resistance (quite visibly above it) is quite meaningful. The situation is not very bullish yet, but it’s more bullish than not at this time. The next resistance is slightly above the 96 level, so there’s quite significant upside potential.
The above has bearish implications for the gold market, however, given gold’s recent ability to rally along with the USD, we could expect the bearish implications to be delayed. Let’s check the signal from the bond market.
Let’s be clear – the above chart doesn’t have meaningful short-term implications. It covers many years to filter-out the short-term price sings and focus on the main trends. The relationships between major economic indicators, such as gold and bond prices, don’t have to work in the short term – they are not technical tools. The way the two markets react to each other can tell us something about the major trends, though.
We divided the entire period into 4 sub-periods. Before mid-2011 both gold and the ratio of 20-year to 1-year bond yields rallied. Then they both declined for about a year. After that the ratio moved higher, while gold declined. The early divergence was a bearish sign indicating a major decline.
In the final weeks of 2014 we saw something different. The gold market finally reacted to the moves in the bond market. The huge decline in the ratio wasn’t able to push gold price lower but gold reacted visibly to a move up in the ratio. They are both rallying together this year. This suggests that the next big change in the precious metals market “is here” and that it was a very good decision to get partly back on the long side of the market with the long-term investments a few tens of dollars ago in the case of gold.
On the above chart, we’ve marked the only situation that was similar to the current one – the 2012 bottom. Both the ratio and gold bottomed after a visible decline and then started to rally together. Back then it meant that a rather significant rally would follow in gold. However, there was some back and forth trading before gold moved much higher.
Will gold decline or rally shortly?
Gold moved visibly higher above the declining resistance line and ended the session close to the 38.2% Fibonacci retracement level based on the 2001 – 2011 rally, which was a significant support at the time and now could provide resistance. The next significant resistance is at about $1,300, which is not only a psychologically important number (being a round one) – it’s also where the rising very long-term resistance line is currently located.
Please note that the long-term cyclical turning point is very close. The previous turning point was due in mid-2013 and the major bottom materialized several weeks after that point. Perhaps it will be the case once again, which means that we could see a bottom after April or so. It’s not a very strong bearish factor, but we’d say it’s something worth keeping in mind – especially given the breaking-out USD Index.
Gold broke above the medium-term resistance line and several other resistance levels, but this move has not been verified, and if the USD Index keeps rallying, it might not be verified. On the other hand, the self-similar pattern that we marked on the above chart in green and red remains in place, which has bullish implications as back in Feb. 2014 gold rallied even higher before stopping.
The RSI indicator just moved above 70, which means that the rally could pause or stop shortly. In June 2013 gold kept rallying for a few more weeks, but it didn’t move much higher. We could be in this type of situation once again.
In our previous alert, we wrote the following:
Because of the rising red support line, the Dow to gold ratio chart tells us that this ratio could move lower, but it’s not likely to move much lower before stopping or pausing. This means that gold could move higher but not likely much higher before stopping or pausing.
Gold has indeed moved higher and the ratio has moved lower, reaching the support line. The implications are bullish for the ratio and bearish for gold.
Silver moved back slightly above the very long-term, rising resistance line, which seems bullish, but let’s keep in mind that silver tends to “fake out” instead of “breaking out”. Breakouts are often signs of a looming decline, which makes us skeptical toward this “traditionally bullish” development.
Gold stocks corrected about half of their recent decline, but the strongest resistance was not reached. The 3 important resistance levels intersect close to the 210 level: the 61.8% Fibonacci retracement, the 50-week moving average, and – most importantly – the declining long-term resistance line. If gold stocks manage to break and confirm the breakout above this level, it might serve as a confirmation that another major upswing is underway. For now, the current rally looks similar to the corrections that saw in July 2013, in late-2013 to early-2014, and in June 2014.
Summing up, while there are some signs that this rally might be the beginning of another major upleg in the precious metals market, it’s still more likely than not that it’s just a correction. Gold seems to be once again responding very positively to the signs from the bond market, but if the USD Index keeps rallying, the yellow metal might give up its recent gains and decline once again. Whether it declines significantly or not, it could be the case that we’re just one decline away from the final bottom before the next major rally.
That’s the clearest thing that we can say based on the current situation in many markets. Things are not as clear regarding the very short-term outlook. Gold could decline based on the USD’s strength or simply because the short-term breakouts have not been confirmed yet. It could move higher based on the self-similar pattern that has been working very well in the recent weeks. It seems that “when in doubt, stay out” is a justified approach at this time. Things might become clearer in the coming days or weeks. We’ll keep you – our subscribers – informed.

Monday, 19 January 2015

Martin Luther King Day  Holiday Schedule
 
PennTrade


Dear PennTrader,

All US markets will be closed on Monday, January 19, for Martin Luther King Day.

Canadian markets will not close, so PennTrade will remain open for your Canadian trades.

US markets will reopen on Tuesday and it will again be business as usual.

Thank you for using PennTrade.
Ron Nicklas
President

This past week in gold

Jack Chan


GLD – on buy signal.

***
SLV – on buy signal.
***
GDX – on buy signal.
***
XGD.TO – on buy signal.
***
CEF – on buy signal.
***
Gold has poked above the 200ema again, prompting breakout calls from some analysts. In a bear market, time is ripe for short sellers to return at current level. And if gold has bottomed and a new bull market is born, price action and COT data will confirm that over the next few weeks.
Summary
Long term – on major sell signal since Mar 2012 when $HUI was at 550.
Short term – on buy signals.
Gold sector cycle – up as of 11/14.
A bear market rally is in progress.

COT data suggests lower metal prices overall going forward.

Swiss National Bank Intrigue

Mario Innecco


Despite the SNB's campaigning against the Swiss Gold Initiative late in 2014 and its assertion that a YES vote would interfere with the bank's policy of capping the franc versus the euro the financial world was rocked by the equivalent of a major earthquake on the 15th of January, 2015 as the SNB decided to do a U-turn and abandon the cap on the franc versus the euro.
We all know by now what happened to the Swiss franc on Thursday so I will focus on why I think the SNB shocked the financial world and in the process wiped out many highly leveraged foreign exchange traders and speculators. Why would the SNB change a policy that it had been adamantly protecting just recently?
I personally think that the continued weakness of the euro versus the dollar has put a great deal of pressure on the SNB as it continued to keep the cap on the franc as the dollar kept rising versus the euro. Even though the Swiss Gold Initiative failed to pass last November there has been political pressure on the SNB to stop inflating its balance sheet.
As a result it is my opinion that the SNB, not expecting the euro weakness of these last few months, decided to get out of a losing trade while it could. By lifting the the cap the SNB is basically saying it does not want to buy any more euros but at the same time it has hundreds of billions of euro paper on its balance sheet. With the ECB expected to announce a new QE program on Thursday the 22nd of January, 2015 I expect the SNB to be a keen seller of its euro assets in the months to come. What better way to sell its euro denominated government paper!
My expectation is that just like FDR the SNB will use its proceeds from selling its euro assets to buy gold. Back in the early 1930s the dollar was the Swiss franc of its day as European capital fled a failing financial system to the relative safety of the then gold backed dollar. This exodus from European currencies to the dollar exacerbated the deflationary economic environment in the U.S. FDR called a bank holiday in 1933 as a result and subsequently devalued the dollar by 75% by raising the official gold price from $20.67 to $35 in January of 1934.
By buying gold the SNB will alleviate the deflationary pressure that a strong currency brings. What better way to unload its mountain of euro assets and at the same time assuage its political foes at home.

The Doughty Swiss


Congratulations to the doughty Swiss, we say. The decision of their central bank to remove the cap on its currency, allowing it to soar against the Euro, is causing the foreign exchnge markets to be struck with the dreaded turbulence. It may well make things difficult for Switzerland in the short run. But it was a vote of no confidence in the quantitative easing that the European Central Bank is about to undertake. It may have put some starch into the Germans, to whom the ECB just bowed by saying it will do its quantitative easing without making taxpayers responsible for losses.
All other virtues of this drama aside, what a paroxysm of panic it has produced at the Financial Times, which has declared that “Thursday’s action in the Swiss franc defies the reach of hyperbole.” We haven’t heard such a primal scream from the FT since Prime Minister Thatcher cut taxes (at that juncture the Wall Street Journal consoled its competitor with an editorial called “Cheer Up, Lads”). The FT calls the Swiss National Bank’s move “a poor advertisement for Swiss reliability.” It suggests the Swiss demarche is “all the more remarkable” because the currency is “prized for its stability.”
We’re not sure “stability” is the word we’d have used for either the Swiss franc or the euro, or, for that matter, the dollar. The latter has lost more than 78% of its value since the start of the century (this morning it was worth but a 1,280th of an ounce of gold). A long-term chart of the Swiss franc shows that it (and the Euro) have kept pace with the dollar in this decline. Gold hasn’t changed its policies once during this period. Its quantity hasn’t changed a whole lot; it’s still inert; and hasn’t anybody found any world-shaking new industrial uses for the silent money. Not even the FT can blame the instability on gold.
The bitter truth is that all the sturm and drang over the Swiss franc is a feature of the age of fiat money. The exclamations of horror that have greeted the decision of one tiny country to stop playing the same game as the bigger countries testify to nothing so much as the absurdity of the fiat system. We’ve never understood the virtues of any country running down the value of its money. We’ve long felt that one country or another — Switzerland, Israel, Britain . . . someone — just ought to stop issuing its currency by fiat and return to a classical system. Wouldn’t it be something if it turns out that Switzerland has taken the first step.

Fallout From the Swiss is a Dress Rehearsal for the Dollar

Dollar-Note
The move in the Swiss was extraordinary because of the massive short-Swiss through loans and their own buying of Euros. The audacity of the IMF to even state they will look into this as if they have any such authority or credibility is just stunning. They want the inside info so they can line their own pockets along with friends.
The British brokerage house  Alpari (UK) Limited has entered insolvency due to the Swiss move. There is no way a Broker can limit the risk of an account when something moves 30%. There is more fallout to come. Just keep in mind this will happen when the dollar rises for there is even a larger short-dollar position around the globe. What we have seen in the Swiss will be the dress rehearsal for the dollar.

Sunday, 18 January 2015

Analysts Expect Gold To Remain Strong Ahead Of ECB Volatility

By Neils Christensen
Safe-haven demand helped gold prices end the week at its highest level since early September and according to most analysts, ongoing volatility should continue to support gold in the upcoming shortened trading week.
Open floor trading of Comex February gold futures settled Friday at $1,276.90 an ounce, up $53.90 or 4.41% since Monday.
The strong move in gold also helped to drive up silver prices as Comex March silver futures settled the week at $17.750 an ounce, up $1.255 or 7.61% since the start of the week.
Although U.S. markets are closed Monday in celebration of the Martin Luther King Jr. holiday, volatility will likely pick up Tuesday where it left; analysts anticipate that markets will continue to recover from the aftermath of the Swiss National Bank’s sudden decision to discontinue the currency peg against the euro, analysts said.
Traders and investors are also look forvolatility to remain high as speculation surrounding Thursday’s European Central Bank monetary policy meeting continues to grow.
“The rollercoaster ride is far from over… as upcoming ECB QE will refocus the spotlight on the monetary policy divergence themes, likely continuing to place stress on US markets as global investors reposition,” said Gennadiy Goldberg, U.S. strategist at TD Securities.
According to some analysts, markets have priced in a 75% chance that ECB President Mario Draghi will announce an expanded quantitative easing that include the purchase of sovereign bonds.
Bill Baruch, senior commodity broker at iiTrader, said the key will be in the details of the program, which he added will probably disappoint the market’s high expectations.
“I think the risk is that the ECB under-delivers. It is going to add uncertainty to the marketplace, and gold is going to look attractive,” he said.
Although Baruch didn’t give a time-frame, he said that with gold’s current momentum, he expects to see prices test the next key psychological area of $1,300 an ounce.
“The path of least resistance for gold is higher,” he said.


Axel Merk, president and chief investment officer of Merk Investments, said that nobody really knows what Draghi is going to do and that uncertainty is going to help gold in the near-term.
He added gold should still perform well after Thursday’s meeting because markets will then focus on the Federal Reserve’s monetary policy scheduled the following week on Jan. 28.
“The Fed has been fairly quiet with their optimism. Everyone thinks they are going to move forward with a rate hike but I’m not so sure,” he said. “Real interest rates are negative right now and gold will do well in this environment. I am happy with my gold positions.”
Ken Morrison, editor of online newsletter Morrison on the Markets, said that he is not convinced that gold will be able to maintain its momentum.
He added that the gold price has hit and taken out his near-term target of $1,250 an ounce and that he would expect to see some profit taking next week.
“If I were long gold at these levels, I would be looking at taking some of my profits off the table,” he said.
One of the reasons why gold has rallied is because of the anticipation of looser monetary policies in Europe; however, with the decision already priced in, he would expect to see a sell-off on the actual event, Morrison added.
Turning to American markets, U.S. data reports are relatively light until mid-week, with the release of housing data; the week ends with an early view of the manufacturing sector, which thanks to recent regional reports, is fairly mixed.
Looking at housing starts, which will be released Wednesday, economists at Nomura said that they are on pace to beat 2013 numbers but construction is still down by historical comparison.
They add “there is still a long way to go in the housing market recovery.”
Martin Luther King Day Holiday Schedule

PennTrade
 

Dear PennTrader,

All US markets will be closed on Monday, January 19, for Martin Luther King Day.
Canadian markets will not close, so PennTrade will remain open for your Canadian trades.
US markets will reopen on Tuesday and it will again be business as usual.
Thank you for using PennTrade.

Understanding the Swiss Central Bank Move and Its Implications for the Rest of 2015: A Guide for Dummies

By Robert Wenzel

As the 2008 financial crises developed, international traders sought the safety of the Swiss franc. This flight to safety intensified as the Greek financial crisis took center stage in 2009.

It resulted in the value of the Swiss franc soaring against the euro  (and to a lesser degree against other currencies).


This franc strength was a great boon to Swiss consumers, as it became cheaper and cheaper to buy  products from other European countries. It, however, had the opposite effect for Swiss manufacturers that exported their products. The products became much more expensive for consumers in other countries that used the euro (and to a lesser degree other non-Swiss currencies).

In 2011, as the franc continued to soar, Swiss exporters continued to put pressure on the Swiss government and the Swiss National Bank. Eventually,  the SNB announced that it would set a minimum value for the euro — 1.2 Swiss francs — and that to enforce this minimum it was “prepared to buy foreign currency in unlimited quantities.” This caused the Swiss franc to fall back from its highs and remain in a trading range.

In order for the SNB to maintain this trading range it had to sop up billions in euros and other currencies  that international investors were willing to exchange for francs. And I do mean billions.


By the end of 2014, the SNB holdings of foreign exchange reserves amounted to more than 500 billion (in terms of Swiss francs) up from under 50 billion in 2009.

In order for the SNB to purchase this huge amount of reserves, it had to print a massive amount of new Swiss francs.


This was not winning fans in Switzerland among the prudent crowd that correctly considered this money printing irresponsible. But here's the kicker. It is widely believed that next week Thursday, after a meeting on the European Central Bank monetary policy committee, the ECB will announce an expanded money printing program. With the SNB propping up activity in place, this would most assuredly have resulted in even more euros flowing into the Swiss franc. In other words, if the SNB continued to prop up the euro after such an ECB announcement. it would have to absorb even more foreign exchange by printing even more francs.

Rather than doing this, the SNB announced yesterday that it would no longer prop up the euro and, instead, would allow it to trade freely. And thus,without the SNB prop, the euro, yesterday. collapsed against the franc. At one point, the euro was down more than 40% against the franc


So why are some financial firms taking huge losses because of this move? Because of something known as the "carry trade." With the SNB printing so many francs, interest rates based in francs were very low. Thus, it made sense, if you thought this policy was to continue, to borrow low interest rate Swiss francs (that is, short francs) and buy (go long)currencies where interest rates were higher. Bloomberg explained in early 2014 the perspective of those that made this trade:
The Swiss franc is offering carry traders some of the best returns in developed markets...Switzerland’s zero-to-0.25 percent target rate makes the franc a natural funder of carry trades. Its credentials may be further burnished by the 1.20-per-euro cap the Swiss National Bank imposed in 2011.
---
“If you were to fund a carry trade in the Swiss franc, the funding side would work out pretty well for you because it won’t get stronger,” Steve Barrow, the London-based head of Group-of-10 research at Standard Bank Plc, said by phone on Jan. 15, 2014.
Barrow recommends selling the franc against the dollar, euro and British pound.
This trade worked well until yesterday. Then it went very, very bad. Think about it. In order to make decent money on this trade, you need to be highly leveraged. On top of this, you were short, Swiss francs, which climbed yesterday by as much as 40%. That is, in order to pay off your Swiss franc obligation, yesterday it cost you as much as 40% more than the rate at the time you borrowed the francs. And because traders employing this method are highly leveraged, they were likely getting margin calls, yesterday, to put up more money immediately or face immediate liquidation. The liquidations were likely massive with traders suffering losses so huge that some will be forced to shut down . That's why we are already seeing foreign exchange brokers reporting massive hits.You can be sure that these brokers have underlying clients that also have huge losses.

Here is a statement released by one foreign exchange broker, most are in pretty much the same condition:
The recent move on the Swiss franc caused by the Swiss National Bank's unexpected policy reversal of capping the Swiss franc against the euro has resulted in exceptional volatility and extreme lack of liquidity.  This has resulted in the majority of clients sustaining losses which has exceeded their account equity. Where a client cannot cover this loss, it is passed on to us. This has forced Alpari (UK) Limited to confirm today, 16/01/15, that it has entered into insolvency.
Bottom line: What is seen regularly in markets is that traders instead of understanding the fundamentals of a situation, trade as though current trends will continue forever. When those trends reverse, the losses are enormous. Because most markets are rigged by central bank manipulations. the potential for all kinds of reversals in trends is possible. Almost no trader believes these trends can be reversed quickly, but when everyone believes they can't and the trend does reverse, and the shift is recognized, it happens very quickly and the losses are massive. Currently very few (I am in a very small minority who does) believe that the fundamentals will ultimately result in very rapid price inflation (5% plus) and much faster hikes in interest rates than almost all expect, sometime by the end of 2015..Because no one is expecting these things to occur, the bloodbaths will be as bad as the Swiss franc carry trade bloodbath we saw yesterday, if not much worse. The year 2015 will be the year of bloodbaths, The Fed and other central banks have simply pushed their manipulations to the edge and they will be forced to reverse direction because of market pressures in the same way that the SNB was forced to give up its propping up of the euro. When this occurs, and traders trading based on current trends have to unwind their positions, financial markets will be rocked to the core.

From Gold Bear to Gold Bull?

Bear markets end with extreme bearish sentiment but positive price action is needed before a trend change can be confirmed. That can include (among other things) breaking downtrends, breaking resistance and breaking the pattern of lower lows and lower highs. There have been positive developments for precious metals beneath the surface but Thursday’s breakout in Gold is more significant. If Gold holds this breakout then it will be all but impossible to argue that it remains in a bear market.
Below is a weekly candle chart of Gold and Silver. Thursday’s Swiss-induced strength helped propel the yellow metal above key resistance at $1240-$1250. Over the past four months Gold has had every opportunity to sustain prices below $1200. Within that period Gold made four different lows from $1150 to $1200. The action of the past two weeks and the break above resistance is a strong signal of an important trend change. Silver breaking its resistance would offer further confirmation of a broad trend change in the sector.

jan15.2015goldsilverwk
Gold & Silver Weekly Candle Chart


We’ve written often about Gold’s relative strength and its importance in signaling a forthcoming trend change. On Thursday Gold closed at a 20-month high in Euro and foreign currency terms and is nearing a two year high against commodities. For months Gold had remained weak against US and global equities. At present Gold is starting to break those downtrends. Below we plot Gold against various equity indices (NYSE, Dow Jones World, MS World, S&P 500).

jan15.2015goldvsstocks
Gold vs. Equities


Meanwhile, the miners have confirmed the rise in Gold. With the exception of GDXJ, every major index has completed a double bottom and is trading around three month highs. The chart below shows the daily line charts of GDXJ and GDX. We include the 400-day moving average which is often an excellent indicator of the long-term trend. The next important resistance figures to be the 400-day moving average. That could coincide with Gold at $1280.

jan15.2015miners
Gold Miners (GDX) & Junior Gold Miners (GDXJ)
End of CB Power – SNB Folds
 
Thomas Jordan, the head of the SNB has repeated said that the Franc peg would last forever, and that he would be willing to intervene in “Unlimited Amounts” in support of the peg. Jordan has folded on his promise like a cheap suit in the rain. When push came to shove, Jordan failed to deliver.
The Swiss economy will rapidly fall into recession as a result of the SNB move. The Swiss stock market has been blasted, the currency is now nearly 20% higher than it was a day before. Someone will have to fall on the sword, the arrows are pointing at Jordan.
The dust has not settled on this development as of this morning. I will stick my neck out and say that the failure to hold the minimum rate will result in a one time loss for the SNB of close to $100B. That’s a huge amount of money. It comes to 20% of the Swiss GDP! If this type of loss were incurred by the US Fed it would result in a loss in excess of $2 Trillion!
In the coming days and weeks there will be more fallout from the SNB disaster. There will be reports of big losses and gains from today’s events. But that is a side show to the real story. We have just witnesses the collapse of a promise by a major central bank.
The Fed, Bank of Japan, ECB, SNB and other Central Banks have repeatedly made the same promises over the past half decade:

Don’t worry! We are here. We will do anything it takes to achieve the stability we desire. We are stronger than the markets. We can overwhelm all forces. We will never let go – just trust us!

I never believed in these promises, but the vast majority of those who are active in financial markets did. The entire world has signed onto the notion that Central Banks are all powerful. We now have evidence that they are not.
Anyone who continues to believes in the All Powerful CB after today is a fool. Those who believed in Jordan’s promises now have red ink on their hands – lots of it!
The next central bank that will come into the market’s cross hairs is the ECB. Mario Draghi has made promises that he would “Do anything – in any amount”.  Like I said, you would be a fool to continue to believe in that promise as of this morning.
We’ve just taken a huge leap into chaos. The linchpin of the capital markets has been the trust in the CBs. The market’s anchors have now been tossed overboard.

What’s In Store For Gold in 2015?

The following article is from Gold Stock Bull contributor, Ben Kramer-Miller.  While I agree with his overall assessment and reasoning, I am a bit more bullish in the short term and think precious metals have likely already found a bottom. Of course, short-term pricing is driven by paper derivative contracts and the emotions of investors that either panic or buy the dip when the sharp price movements occur, so anything is possible in the short term. In the medium to long-term, we both agree that prices for both gold and silver are moving substantially higher and that 2015 will prove to be an excellent year to accumulate metals and undervalued miners.  Cheers – Jason Hamlin
Overview
After a lousy 2013 gold was essentially flat in 2014. The London AM fix on December 31st came in at $1,199.25 in 2014 vs. $1,201.50 for 2013.

The year started out strong and many gold bulls called the end of the downtrend. However a strengthening US Dollar, signs of economic growth in the US, and concerns over the Fed’s tapering program put an end to the bull market pretty early in the year when gold peaked in March at ~$1,370/oz.
These signs, among others (which I will discuss in a moment), prompted me to call for more downside in the gold market in September when the price 
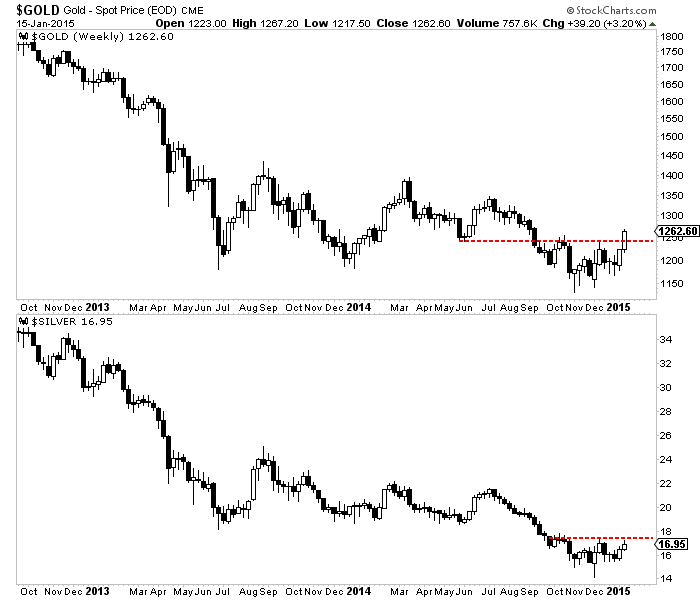
was hovering around $1,300/oz. Shortly thereafter the gold price fell below its critical support level of ~$1,180/oz. and traded down to ~$1,135/oz. before rebounding back to today’s range, which is roughly $1,180 – $1,220/oz.
So where do we go from here?
As a gold bull I want to believe that gold is going to start moving higher from here, but unfortunately I think the odds remain stacked against this, and that we will see further downside before the bull market resumes. I will first go through the reasons why I think this is the case and I will then discuss how to play this.
Why Gold Probably Has More Downside
Again I discussed some of the reasons I think gold has more downside in the near term in September. It is worth repeating/updating a couple of these reasons, and I also want to bring a couple others into the mix.

1-Gold Didn’t Test Its 2009 Breakout Point

Gold has experienced two significant corrections since the bull market began at the turn of the century. The first was in 2008 and the second began in 2011. One thing that differs between the two besides their durations is that when the market bottomed in 2008 it hit a major support level of ~$700/oz. This level is technically significant because it had previously been resistance from April, 2006 through August, 
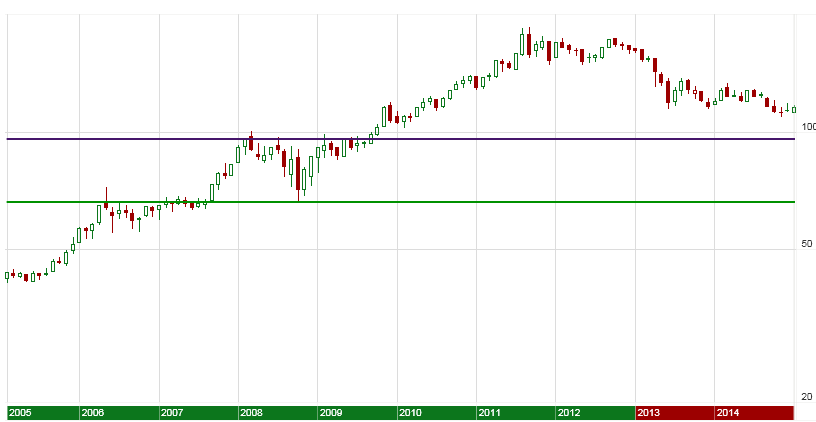
2007. But we have not seen gold test its previous breakout point in this downtrend. The last breakout point was the resistance level of ~$1,000/oz., which is where the market peaked in 2008. The breakout led to the subsequent rally all the way to ~$1,900/oz. in 2011. Now if the pattern were going to repeat the gold market should test the $1,000/oz. level, but as you can see on the following 10-year chart of the SPDR Gold Trust (NYSEARCA:GLD) we haven’t seen this.

Technical analysts would argue that a test or even a quick breach of the $1,000/oz. level (or ~$95/share for the GLD) would wipe out the speculative money that entered the market after the gold price broke to its new all-time high, and that this would be needed in order to set the stage for a fundamentally driven leg higher.

2-Stocks and Bonds Remain In Favor

Broadly speaking I am not bullish of stocks, and I am downright bearish of bonds. But there is no denying that these assets have been performing well over the short and intermediate term. While the mainstream financial press would have you believe that these assets trade opposite to one another they are historically correlated, and pertinent to this discussion they are negatively correlated to gold.
Stocks and bonds are both financial assets, meaning that they are claims against another entity that owes something to the stock or bond holder (e.g. dividends or interest payments). Despite the fact that stocks and bonds are richly valued on an historic basis investors don’t seem to care. Easy credit from the Fed makes these low returns appealing on a relative basis, and this puts pressure on assets whose value is intrinsic such as gold and other commodities.
At least in the near term bonds will remain expensive because central banks will see to it that interest rates remain low, and stocks respond to this as low bond yields make stock dividend and earnings yields more attractive by comparison.
With financial assets in favor real assets are, by extension, out of favor. Commodities in general–not just gold and precious metals–have been weak with very few exceptions.
Now financial assets are, broadly speaking, overvalued while commodities are generally undervalued, and this includes gold. But the market is not at a point where these disparities really matter. So long as money remains cheap bond prices can rise and anything that has a yield can rise with them. At some point this situation will reverse itself, but for now it suffices to say that it makes sense to yield to Newton’s first law of motion, and acknowledge that financial assets will keep rising while tangible assets will keep falling until something happens to reverse this trend.

3-Federal Reserve Tapering and Rising Interest Rates Are Perceived To Be Bearish for Gold

This follows from the misconception that I just discussed. Many investors are concerned that the Fed has stopped pumping money into the market via its QE program, and that this is bearish for gold. The intuition is that there will be less money in the financial system to bid up gold prices.
The fact is that if the Fed raises rates there may very well be less money in the system. And this perception has the potential to drive some naive investors out of the gold market and some speculators to short the market.
We’ve seen, however, that this is misguided and we will shortly see just how misguided this actually is.

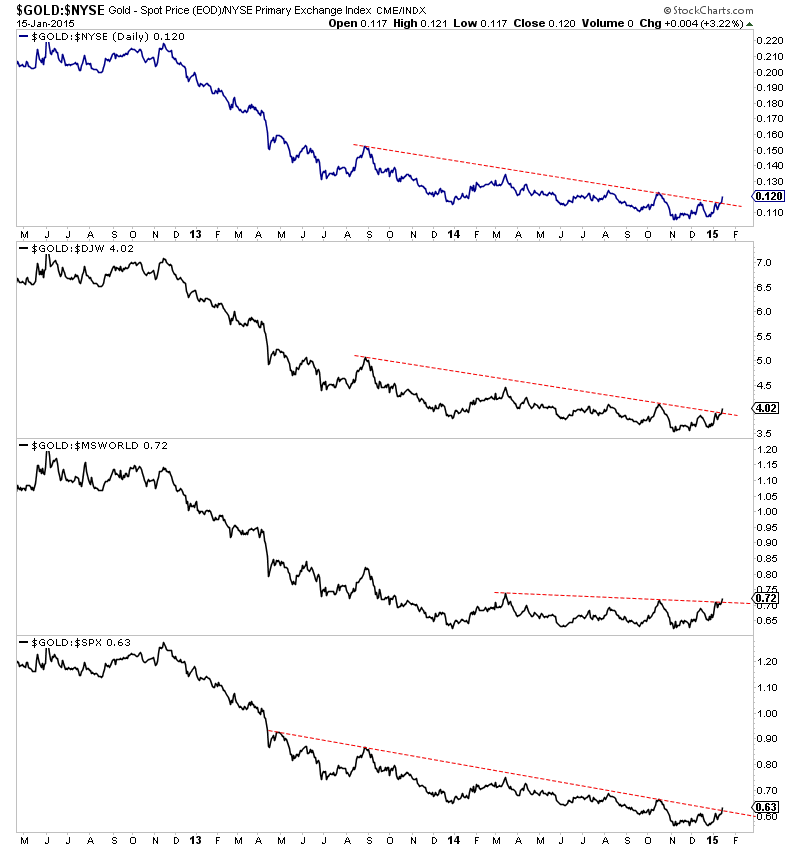
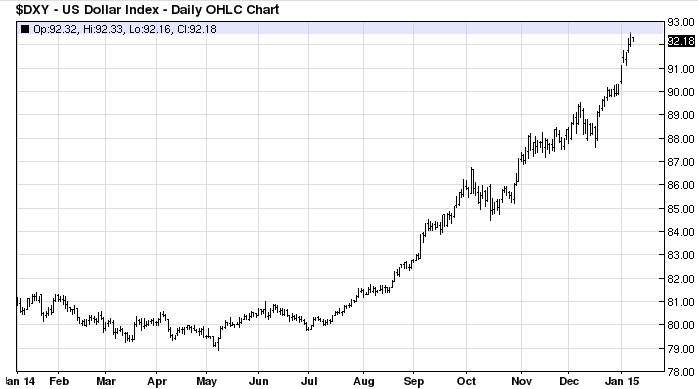
4-The Dollar Index Has Been Strengthening

One of the big surprises this year has been the strength in the Dollar Index, as you can see on the following chart. courtesy of Barchart.com.

This strength has led investors to believe that the Dollar itself is strong, and it leads investors to avoid investments in gold and in other commodities.
Now gold bulls know that Dollar Index strength is not the same thing as Dollar strength. The former simply means that the Dollar is increasing in value relative to a basket of currencies that includes the Euro, the Yen, the Pound, and others. But this doesn’t mean the Dollar itself is strong. For instance, the Dollar Index has gained about 15% since its 2008 low, but the Dollar has lost about a fifth of its value relative to gold.
Nevertheless in the short run this perception can trump reality, and a rising Dollar Index can be short-term bearish for gold.
The Bullish Perspective: Rising Rates Will Send Gold Soaring
A novice view of the phenomena just discussed paints a very bearish picture for the gold market.
But a deeper analysis of these phenomena–particularly the second and the third–paints an extremely bullish picture.
We saw earlier that QE and ZIRP has created demand for bonds and stocks because even their paltry interest rates are attractive in the context of very low interest rates available on cash/equivalents while there is more money in the financial system to bid these assets higher. This takes away money from the gold market which doesn’t generate any income.
While this line of reasoning makes sense unto itself I think a lot of investors are confused in the sense that quantitative easing and ZIRP (i.e. zero interest rate policy) have not pushed gold higher. Shouldn’t a rising money supply have precisely this effect?
In spite of this intuition the above line of reasoning holds and historically the gold price has performed best when the Fed’s benchmark rate has been trending upward. I discussed this at length in another article and I have imported the following chart for the reader’s convenience.

Investors who don’t understand the logic behind the obvious correlation here should think of it as follows. Low interest rates and a rising money supply are bullish for gold in the same way that pushing a beach ball under water is “bullish” for the beach ball in the sense that when the pressure is lifted the beach ball will fly higher than it would have otherwise. To put it another way low interest rates are bullish for gold in that they give it potential energy, but kinetic energy will send it higher, and it will take rising rates to convert this kinetic energy into potential energy.
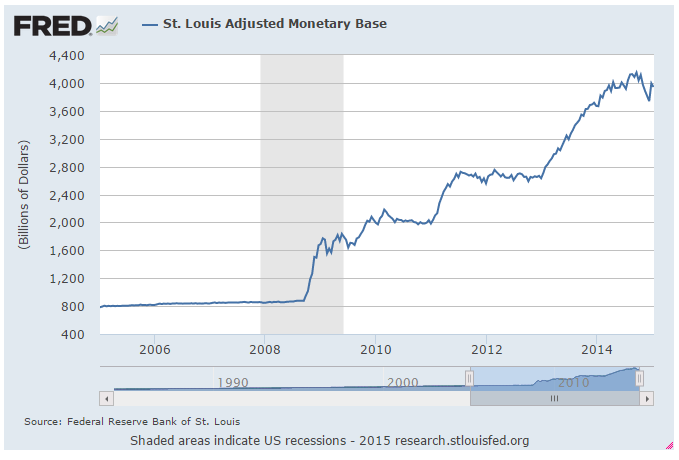
With that being said gold I think it is important to point out that gold is being infused with an unprecedented amount of “potential energy” in the sense that never in this history of the Federal Reserve has the monetary base risen so rapidly. We can see in the following chart that the monetary base has risen 5-fold (17% per year) in the past 10 years.

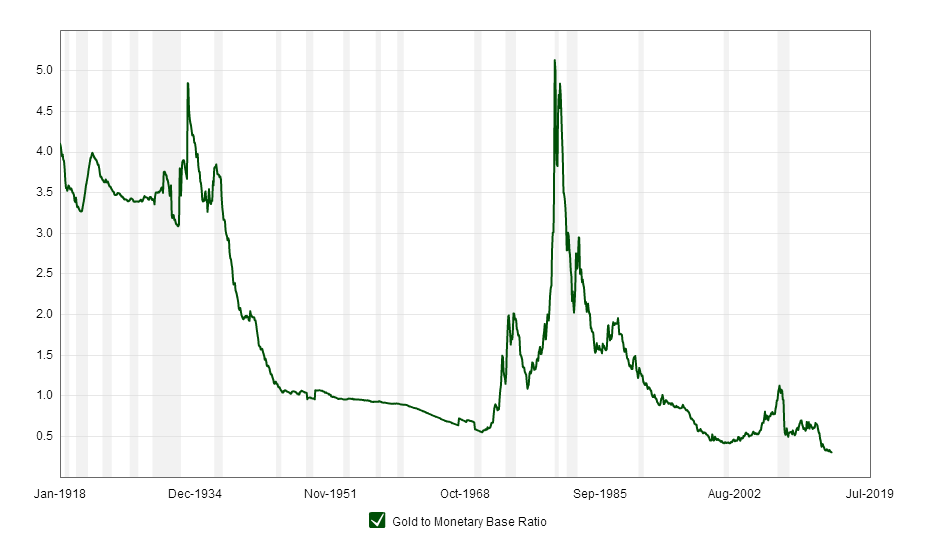
Gold doesn’t necessarily trade with the monetary base but we can use it to get a good idea of gold’s relative valuation by looking at the value of America’s gold relative to it.

We can see that using this metric not only is gold undervalued, but it is more undervalued than it has been since 1918, which is as far back as the Fed’s monetary base data goes. We can also see that in spite of the fact that the gold market traded to a nominal record high in 2011 that it has–from at least one perspective–been in a bear market for the past 35 years.
What Will Signal The Turnaround?
So gold is incredibly undervalued and is perhaps in a multi-decade long bear market. Why should the downtrend end anytime soon, and what should we look for as a signal that the bear market is actually coming to an end?
We’ve already seen the answer to this above–rising rates. The Fed has signaled that it will raise its benchmark interest rate starting this year for the first time since 2008, and we’ve seen that this will make bonds and stocks less attractive on a relative basis, and some of this “excess” money will find its way into gold.
So one scenario is that the Fed increases rates, the gold market has a knee-jerk reaction to a new low as pundits ramble on about how negative this is for gold, and then the market reverses sharply from its new low and begins a new uptrend.
There is a problem with this scenario, however. Every time the Fed has removed stimulus from the market the stock market has fallen and it begins a new “panic,” which in turn gives the Fed an excuse to continue with more stimulus.
I think we can still see gold rise in this scenario because interest rates can only go so low and bond/stock yields can only go so low as well. Already bond and stock yields are at historic lows, and while the can go lower eventually their overvaluations will get the best of them 
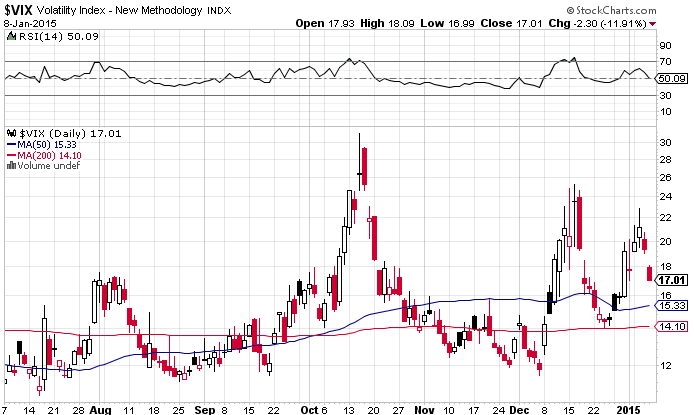
and we can see money enter the gold market. One might argue that we may already be on the verge of this given some signs such as the downturn in junk bonds (see the following chart of the iShares High Yield Debt ETF (NYSEARCA:HYG) and the uptrend we’ve seen in volatility. Both charts are courtesy of Stockcharts.


But in this case what sort of signal should we look for? that the gold market has turned?
In this scenario I think investors should look at Gold Forward Offered Rates (GOFO). This is the rate at which bullion banks lend gold. The lower the rate the more desirable it is for banks to hold gold.
But what specifically should we look for, and how does this tie in with the current scenario?
A lot of investors suggested recently that the fact that the GOFO rate went negative towards the end of 2014 that the gold market had likely bottomed. I think this is misleading considering the current low interest rate environment that we are experiencing, and this point is supported by the fact that GOFO went negative in 2013 and this didn’t signal a bottom in the gold market.
What we need to see, therefore, is for bullion banks to value gold substantially more than they value interest-bearing paper assets, and so I think the signal to look for will be relative GOFO rates. This is a data point that is measured via LIBOR minus GOFO. If this rises substantially it means that investment banks would much rather hold gold than interest bearing assets as short term interest bearing assets are correlated at least in part to LIBOR rates.
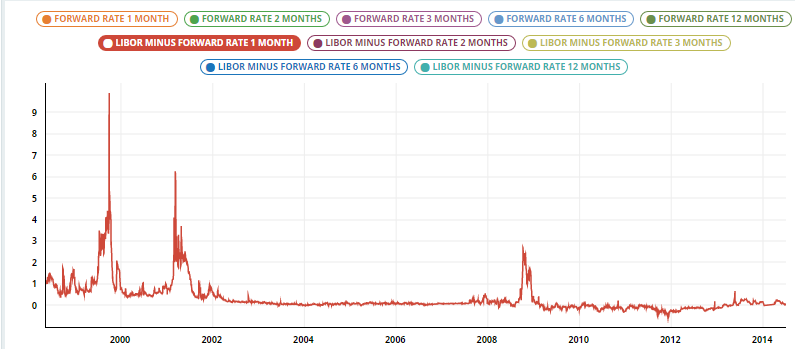
When we back-test this thesis we can see that spikes in 1-month LIBOR minus GOFO have been predictive of new uptrends in the gold price.

Each major spike has corresponded with a buy signal in the gold market. Now if we zoom in on the past couple of years we can see some mini-spikes, but nothing resembling the 1999, 2001, and 2008 spikes pictured above.

Friday, 16 January 2015

Trend Change? Gold Breaks Above 200 Day Moving Average

Jeb Handwerger


For weeks I have been predicting that precious metals and the junior gold miners would bottom and outperform in January. Now gold is breathtakingly breaking above the key 200 day moving average and breaking four month highs as the World looks to gold as a safe haven. The intermediate to long term trend may be turning positive and unfortunately the amateur investor has already panicked out or may be covering their shorts.
This breakout in gold could end the lower high pattern or downtrend. Sentiment is changing from negative to positive. Already for weeks, I highlighted the positive momentum in the junior gold miners despite the new low in December. This divergence usually signals an interim bottom and turning point. A few weeks ago precious metals and the shares were hitting new lows. The amateur investor panicked out. I told my subscribers to hang on and buy more at the bottom. Now the Junior Gold Miners are up over 14% since the beginning of the year outperforming the S&P500 and US dollar.
Despite oil and copper collapsing along with equities, precious metals and mining stocks appear to be bottoming and showing great relative strength. Right now, gold as a safe haven may be where the action is greatest. The US dollar may peak as investors realize that the US economy is still far from recovered. The oil and copper collapse is giving a loud shout to investors that the global economy is nowhere near recovery and looks more like the 2008 Financial Armageddon. One of the few things that can maintain its purchasing power in this sort of market is gold. Believe it or not another yellow metal which has held up well despite the 50% correction in oil is uranium.
I told my subscribers at the end of 2014 that smart investors should be defensive against the overbought equities with inverse S&P500 etf's such as Proshares Short S&P 500 (SH) or a short financial fund (SEF) and go long gold (GLD) and junior gold miners (GDXJ) in this sort of chaotic environment. The banks are sitting on major energy losses, while the S&P500 is made up largely of energy stocks and companies who profit off of emerging economies. It is way overbought and we could witness a powerful crash in equities that mirror the oil crash.
I believe mining assets with real potential could come back into favor. I am accumulating hoping that within the next decade we could see a major run higher in this sector. Eventually, the trillions of debt will be paid back with devalued US dollars. Rising interest rates and inflation could pick up in 2015 especially in the US benefitting our beaten down wealth in the earth sector.
Real gold mining assets in stable jurisdictions will go up in value. I especially like the junior gold miners especially the explorers now in Nevada and Quebec. Governments can print another trillion dollars by pressing a button at the printing press. This can't be done in the gold exploration business. It takes years and a lot of divine blessing to find a million ounces of gold. Investors may now be able to believe this as gold breaks above the 200 day moving average.