This is featured post 2 title
Replace these every slider sentences with your featured post descriptions.Go to Blogger edit html and find these sentences.Now replace these with your own descriptions.This theme is Bloggerized by Lasantha - Premiumbloggertemplates.com.

This is featured post 3 title
Replace these every slider sentences with your featured post descriptions.Go to Blogger edit html and find these sentences.Now replace these with your own descriptions.This theme is Bloggerized by Lasantha - Premiumbloggertemplates.com.

Friday, 21 November 2014


Self-help guru Tony Robbins is out with a new book which offers a slew of financial advice including an “All Weather Portfolio” (AWP). Without delving into too much detail (others have already done this favor for us….), the crux of Robbins’ All Weather Portfolio is a recommendation to allocate 55% of ones portfolio into US Treasury Notes & Bonds:
“Then you need long-term government bonds. 15% in intermediate term (7- to 10-year Treasuries) and 40% in long-term bonds [20- to 25-year Treasuries].”
The concept here isn’t rocket science; bonds help to reduce overall portfolio volatility which would otherwise be quite high if a portfolio consisted only of equities:
An example of a portfolio’s best, worst, and average returns given the percentage stock/bond allocation
Mr. Robbins (primarily with the help of hedge fund legend Ray Dalio) is also advising his followers to rebalance their portfolios at least annually which will mean that assets which have appreciated will be trimmed and investors will accumulate more of those assets which have underperformed.
The combination of recommending that novice/intermediate investors plow 55% of their portfolios into US Treasuries at record low yields AND also encouraging them to ‘rebalance’ regularly (which basically means adding to losing positions and selling winning positions) strikes me as an especially reckless and potentially toxic formula. The reason that the AWP backtests so well is that we have just experienced an epic 30-year bull market in bonds:
Click to enlarge
Long-term US Treasury Bond yields have never been lower
Many ‘gurus’ have been calling for a top in the US Treasury market for quite some time, thus far they have all been badly wrong. However, they probably won’t be wrong forever and the level of complacency currently being exhibited by bond market participants should prompt investors to raise an eyebrow or two.
Meanwhile a couple of key ingredients that seem to have been missing from forming a lasting top in Treasuries (a bottom in yields) is unanimous acceptance among investors that yields are going to stay low for a long time to come and heavy retail investor participation in the bond market. During the past several months we have begun to see both of these begin to play out with investors chasing yield through high-yield corporate bonds and leveraged loans while a widespread ‘deflation’ meme has been circulating throughout I-Bank research reports and the assorted financial media punditry. Is the Tony Robbins All Weather Portfolio the final ingredient necessary for a long-term top in bonds to be put in place?


Gold: Now What?
Mary Anne & Pamela AdenThe Aden Sisters
Gold has been volatile in recent weeks. It broke down, then it bounced back up. So where does it currently stand?
Gold’s timing will help us in identifying the lows and the steps upward towards a new bull market.
Chart 1 shows our favorite gold timing tool. As our older readers know, gold has had recurring cycles going back for years.
(Click on image to enlarge)
Currently, a D decline has been underway since last March when gold’s 2014 rise petered out. D declines tend to be the worst decline in gold’s cycle. And during bear markets, D declines usually take gold to new lows for the bear market.This is exactly what happened this month. Most impressive, the leading indicator has yet to fall into the extreme low areas that normally coincide with D lows... This means gold could still go lower before this decline is over.
On the downside, gold will remain weak below $1200, and especially below its $1180 low. And the longer this is the case, the more likely we’ll see lower lows soon.
A clear decline below $1150 means $1100 would be a shot away. This would likely take the indicator down to test the extreme D lows.
GOLD SHARES: Fell the most
Gold shares, however, took the cake. They plunged much more than gold and silver. And the gold share indexes fell to their 2008 lows. That is, they fell to the lows of the depths of the financial crisis washout.
The HUI Gold Bugs index is now starting to consolidate near these lows above 150, and as long as that’s the case, we just may see the start of constructive base-building.
Gold mining shares are weaker than gold, the most they’ve ever been since the 1960s. This weakness is not over yet, but the 5 week moving average works well in identifying the start of a turn.
So keep an eye on 170 for HUI. If it can stay above this level, gold shares will be looking better and they could then be leading gold.
Wednesday, 19 November 2014


Dollar Weakens, Ukraine Freaking
Editor's Note: Technical expert and star of Kitco's popular show Chart This!, Gary Wagner will now provide Kitco.com visitors with an exclusive evening recap Monday to Thursday at 6:00 p.m. EST. The commentary, called Hawaii Six-O, will provide a brief overview of the day's news as it relates to gold. A former city guy, Gary abandoned the briefcase and tie, and joins us now daily from Hawaii. Whether you are a newbie or veteran trader, Gary provides a great overview for all levels of investors.
The euro turned bullish today and that drove the U.S. dollar down, thus pushing gold prices up.
The tensions in Ukraine between, on one hand the eastern and western parts of the country, and on the other between Russia and the West, are rising.
German economic sentiment index rose by 15.1 to a four-month high of 11.5 this month over October's reading of -3.6. Most analysts had expected the index to improve by 4.5 points to 0.9 in November.
In addition, the index of the full euro zone's sentiment increased to 11.0 in October, up from 4.1 in September, well above expectations of 4.3. The unexpected rises gave the euro the shot in the arm it was looking for.
In the U.S., meanwhile, inflation seems to be warming up, though scarcely can it be considered as heated. Drops in fuel prices, stagnation in durables and the usual inflationary questions about food prices are keeping the rate just below where the Fed said it wants inflation to be.
On to the Ukrainian crisis... Why Vlad Putin wants a war with Ukraine is anyone's guess. We imagine he's thinking nationalism trumps economics. Without citing at least three or four dozen historical examples to back our thinking up, suffice it to say that nationalism does not trump economic interest. In fact, economics is a huge part of national success.
The Ukrainians are not backing down from the bully, either. It seems there was, for a while back in September, a chance that Ukrainians were willing to let Crimea go and Russia was willing to keep out of the issues concerning "Russian" areas of Ukraine. Of course, that's now fallen apart.
And here we are on the brink of a nasty land war in Russia/Ukraine. And, if the Russians think they are immune from attack, they haven't been paying attention to the upgrades to the Ukrainian forces courtesy of NATO.
Regardless of other causes and consequences, we know that the turmoil is helping gold prices rise. And that's just in time for Russia's big gold-buying spree. Russia had better buy gold. Their currency is becoming less useful by the day.
Yet another worry for Vlad is the continuing decline in energy prices. Today, in spite of a weaker dollar, WTI crude is down 1.80%, Brent is down over 1% and natural gas is down almost 2%.
Bond yields are flat. All risk-on plays went to the euro and, to some extent, gold. Oh, and that other investment type...
Are the equities markets plowing ahead? Yes they are. So risk money is continuing to be pushed into stocks and records are being broken almost daily.
EDITOR'S NOTE: Please be aware of this month's travel and holiday schedule, which will run through November 30th, including Thanksgiving. Additionally, during that period, I will be in Indonesia, lecturing to key gold traders there. The time differential will make it necessary for me to send out the regular fundamentals (upper portion) of the newsletter at the usual time. The videos' timing may be different. You will receive special notification immediately following the release of a new video, which will appear on the website. Of course, trade alerts will not change. I will monitor markets as usual and have all equipment necessary to produce videos. Thank you.


Gold & Silver Trading Alert:
Gold and Miners Soar on Huge Volume
Przemyslaw RadomskiBriefly: In our opinion no speculative positions are currently justified from the risk/reward perspective.
Gold moved substantially higher on Friday and the volume was huge. The session was both significant and bullish, but the question remains if such show of strength can be a start of the next big move. As we promised in Friday’s second alert, we analyzed the situation thoroughly over the weekend and are reporting to you today.
Let’s jump right into charts (charts courtesy of http://stockcharts.com).
First of all, let’s take a look at something that didn’t change – the situation in the USD Index.
(Click on images to enlarge)
The Index remains in the triangle pattern. The important thing to keep in mind is the intra-day attempt to break above the upper border of the pattern, which was invalidated shortly thereafter.If the USD Index breaks down from the triangle patter, it’s not likely to fall much further – there are short-term support levels at the Oct. high and the rising black support line. We don’t expect the USD Index to move visibly below the 86.4 - 87 area. We would expect the rally to resume after this area is reached.
On the other hand, if the USD Index does indeed rally right away, then it could move much higher before it really tops (above 89).
Theoretically, this means that gold has limited short-term upside and bigger downside. Does it?
The significant downside is definitely present, as there was no move above the declining (red, dashed) resistance line and gold didn’t close the week above the previous 2013 low (in terms of weekly closing prices).
On the short-term chart we see that gold corrected to another importantretracement level – the 50% one. Is it enough to stop the rally? It’s certainly possible, but after such a sizable daily rally on strong volume, we can expect some more strength in the coming day(s). So, how high can gold go? To the following resistance levels, of course. The next one is the 61.8% Fibonacci retracement, and a bit higher we have the declining short-term resistance line. It seems likely to us that one of them will stop the rally, as they more or less correspond to the support levels in the USD Index. Which of them is more likely? It’s a touch call at this time – it seems that focusing on other markets / ratios and waiting for a confirmation is a good idea at this time.
Speaking of ratios – can the gold:USD Index ratio tell us something?
Yes, but that’s generally a confirmation of what we’ve already written above – that gold could move a bit higher before it continues to slide. In this case, we would see a move back to the previously broken horizontal support and then a continuation of the decline.
From the non-USD perspective, we have no decisive signal. On one hand we’ve just seen a weekly reversal on strong volume, which is a bullish sign, but on the other hand we’ve just seen another move back to the previously broken rising support/resistance line (the breakdown was not invalidated, so the implications remain bearish).
Let’s move to silver.
From the long-term perspective, the consolidation seems to continue, which is in tune with what we saw in April 2013. The analogy to this month has bearish implications as back then declines followed. Please note that silver spent a few weeks trading back and forth before its decline continued, so just because silver is not moving lower again is not concerning.
In Friday’s first alert, we wrote the following:
By opening short positions now, we would risk being thrown out of them if PMs rallied temporarily and sharply before declining again. Please recall that silver has been known for such counter-trend rallies right before plunging.
On the short-term SLV ETF chart we see that the rally was very significant on a daily basis. It was definitely good to watch this from the sidelines instead of keeping a short position open. Silver moved to the 20-day moving average, but does it mean that silver can’t move higher? It could – it’s currently correcting a huge decline, so we wouldn’t be surprised to see a move even higher – to the declining resistance line – before the upswing is over. Please note that in October silver also moved temporarily above the 20-day moving average only to decline shortly thereafter.
Examining silver from the non-USD perspective provides us with the same outcome as the analysis of the gold charts. Namely, the corrective upswing is likely not over yet, but it’s not likely to take metals much higher either.
Let’s take a look at gold stocks.
Gold miners have their resistance level relatively high, but since they are ones that have recently dropped particularly significantly, it’s no wonder that the correction is also big. Our comments from the Nov. 10 alertremain up-to-date:
Gold stocks moved higher last week after reaching our initial target area but that’s no proof that the decline is completely over. During the 2008 decline there were sharp corrective upswings as well, but they didn’t mean that the decline was over. The current decline has been significant, so a corrective upswing (a pause within the decline) would be something normal.
How high could gold stocks go before the decline is resumed? It’s a tough call as the market has been very volatile lately, but at this time we wouldn’t rule out a move back to the previously broken support at the 2013 low. The 38.2% Fibonacci retracement based on the recent decline is very close to it, so it seems quite likely that the 185-190 level would stop a rally.
Junior miners can also tell us something (more precisely, their performance relative to other stocks).
The above chart features the GDXJ to SPY ratio, which means that it will move higher when juniors rally faster than the general stock market. The volume is actually the ratio of volumes. The things that are particularly interesting are situations when we see sudden spikes in the volume (a ratio of volumes). This is when juniors are a particularly “hot topic” – of course on a relative basis. The useful tendency is that these times very often precede or mark important price tops in the precious metals sector. The spikes that we saw in the last 2 weeks were historically high. They were so huge that they made the spikes seen before 2013 barely visible on the above chart. Consequently, the bearish medium-term implications are clearly in place and based on them we could expect another downswing soon, but not necessarily right away. This is in tune with what we concluded based on the analysis of the previous charts.
Summing up, the precious metals sector continues to correct its recent downswing, while remaining in the medium-term downtrend, and it seems that it will move a bit higher before turning south again.
As always, we will continue to monitor the situation and report to you – our subscribers – accordingly. We will aim to multiply the recent profits and will quite likely open another trading position shortly – stay tuned.
To summarize:
Trading capital (our opinion): No positions
Long-term capital (our opinion): No positions
Insurance capital (our opinion): Full position
You will find details on our thoughts on gold portfolio structuring in theKey Insights section on our website.
As always, we'll keep our subscribers updated should our views on the market change. We will continue to send them our Gold & Silver Trading Alerts on each trading day and we will send additional ones whenever appropriate. If you'd like to receive them, please subscribe today.
We were bullish on gold as far medium-term is concerned for the vast majority of the time until April 2013. After that we have generally been expecting lower prices. Are we gold bears? No - we view this decline as lengthy, but temporary. We expect gold to rally in the coming years, but instead of following the buy-and-hold approach, we exit the long-term precious investments at the most unfavorable times and re-enter when things look good again, thus saving a lot of money. Additionally, our Gold & Silver Trading Alerts help you profit from the short-term price swings. We invite you to examine our premium services and encourage you to sign up for our free mailing list today.


Gold: Bull Flag In Play
- Just hours ago, gold staged a nice upside breakout, from a bullish flag pattern. To view this exciting action on a short term chart, pleaseclick here now.
- After rising from an inverse head and shoulders bottom pattern, gold promptly formed a bull flag. The target of this pattern is the $1235 - $1240 price zone.
- Please click here now. That’s also an hourly bars chart, with the uptrend channel highlighted. A rise above $1200 could usher in a lot of momentum-oriented buying, creating a near-vertical surge to the $1235 -$1240 price zone.
- In my professional opinion, gold demand in India for Diwali has been the main price driver of this rally, and that demand has overwhelmed speculators carrying short positions on the COMEX.
- Tremendous corruption exists in the Indian government, and the bullion banks that have traditionally controlled most gold imports, are not happy with the recent decision of the Indian central bank to allow non-bank entities to compete with them.
- The profits made by the bullion banks have shrunk from $100 - $200 an ounce to just $10 - $20 an ounce. As a result, the banks and the Indian finance ministry are putting tremendous pressure on the Indian central bank to restore the bullion bank imports cartel.
- ‘India is likely to announce measures to curb gold imports as early as Tuesday, a senior finance ministry source said…. "We are working on it. The measures to slow gold imports are almost ready and may be announced today or tomorrow," said the source, who declined to be named because of the sensitivity of the matter.’ –Reuters News, November 18, 2014.
- A new round of restrictions appears to be imminent. That will empower the mafia and the bullion banks, but it’s unlikely to change the total amount of gold being imported into India.
- Even if India has to take a step or two backwards temporarily, an important policy maker at the European Central Bank has just suggested that the ECB could begin a gold buying program. This is fabulous news for the Western gold community.
- “The Board of Governors has unanimously advocated, where appropriate, to take further unconventional measures to counteract a lengthy period to lower inflation. Theoretically, this also includes the purchase of government bonds or other assets such as gold, shares, Exchange Traded Funds (ETF) etc.” –Yves Mersch, ECB Executive board member, in a speech posted on the ECB website yesterday. To view the entire speech, using the Google translator, please click here now.
- Mersch speaks forcefully, about the need to raise the European inflation rate.
- My Indian jeweller contacts believe gold and silver can rally for several more weeks before suffering a significant sell-off. Please click here now. That’s the daily silver chart, and it looks ready to rally.
- There’s also a potential flag pattern in play on that chart. To view it, please click here now. A breakout from the flag pattern appears to be imminent. That could help ignite a period of outperformance by silver against gold!
- When gold and silver stage a tradable rally, the mining stocks tend to do very well. On that note, please click here now. This GDX daily chart suggests that gold stocks are poised to rally to $20, $22, and perhaps to $25.60, before any kind of shorting or selling opportunity presents itself.
- I think the $25.60 price target is realistic and achievable. To understand my thinking on this key issue, please click here now. That’s the GDX weekly chart, and it looks superb.
- Note the action of the 14,3,3 Stochastics oscillator. GDX can easily rally ten dollars on a crossover buy signal, and it seems poised to do so right now.
- Please click here now. That’s the GDXJ daily chart. Junior gold stocks tend to outperform the seniors during a serious rally, just as silver tends to outperform gold, during a serious precious metals price rally.
- If GDX can rise to $25.60, and I think it can, then GDXJ should rise to $40.
- A lot of amateur investors have been caught off guard by this precious metals rally. There are a number of reasons for that, and an overly-simplistic view of the relationship between the Japanese yen and gold is one reason for their failure.
- Many of them were carrying large short positions in gold. Carrying a small tactical short position is the action of a professional investor. In contrast, wildly shorting the world’s ultimate asset with large amounts of leverage is very dangerous.
- Most fans of the yen-gold relationship thought that when the US dollar surged against the yen, it would surge against gold, but the opposite has now occurred; gold is surging against the dollar!
- Please click here now. That’s the weekly chart of the US dollar versus the Japanese yen. The dollar’s upside progress is fading. The Stochastics oscillator looks ready to move sharply lower. If gold can move aggressively higher while the yen is collapsing, as it is now, one can only imagine the potential “super surge” in the gold price, if the yen begins to rally.
- I think that situation is going to occur very soon. I also would not be too quick to count out the head of the Indian central bank, Raghuram Rajan. He is a master tactician and strategist, and turned the 80-20 import rule against the bullion banks, by adjusting the fine print of the rule. In India, home of the most powerful gold demand in the world, oil prices have fallen, the rupee is stable, inflation is moderating quickly, GDP is growing, and the current account deficit is now a tiny part of GDP. Yet, incredibly, the government and the bullion banks still seem obsessed with claiming that buying gold is a cause of financial weakness. This makes them look corrupt and ridiculous.
- Gold is in a tremendously strong position right now. The weekly charts are very bullish, and flag patterns are in play on the shorter term charts. Fundamentally, India is a force to be reckoned with for decades to come. The Swiss referendum is a bullish wild card, and the potential for the ECB to become a gold buyer is growing. Almost all the lights are green, for gold!
Wednesday, 12 November 2014


Silver to S&P Ratio: What It Tells Us
Posted on by Gary Christenson
Now look at the 13 years since 9-11 when the gold, silver and commodities bull markets began.
- Silver to S&P Ratio (Si/SP) is currently at an 8 plus year low.
- Si/SP is below its upward linear trend shown in red since 9-11.
- Over the long term the ratio shows the desirability of hard assets such as silver versus the desirability of paper assets such as the S&P.
- The ratio declined from 1980 to about 2001, increased to 2011, and crashed since then.
- QE started in late 2008 and stimulated the S&P off it March 2009 lows. Most of the $Trillions in newly created Fed dollars went into the stock and bond markets, and not into the silver and gold markets.
- Subsequent to 2011, the S&P has charged upward while silver has crashed to about 30% of its April 2011 high.
COMPARISONS:
Item S&P Silver3 – 5 year history Triple since lows Down by 70%
Recent activity All-time highs 70% below all-time highs
The Fed & QE QE levitates the S&P QE – not much help
Chinese purchases Probably not Huge purchases
Warfare increasing Likely to hurt S&P Likely to help silver
Middle-East trauma Likely to hurt S&P Likely to help silver
Political turmoil Likely to hurt S&P Likely to help silver
We could go on, but it is clear to me that the S&P is near all-time highs and is at risk from declining QE, excessive valuation, increasing wartime threats, Middle-East trauma, and US political turmoil. Silver is near a 5 year low, 70% off its highs, and likely to rise based on the same issues that could hurt the S&P.
The Si/SP ratio shows that silver is deeply oversold and far below its typical levels. The ratio is at an 8 year low, even below the 2008 silver crash lows, and not far above 30 plus year lows.
Based on Friday’s upticks, last week may have been the turning point for silver prices and the silver to S&P ratio. Or perhaps the S&P will continue reaching for the sky even though QE is supposedly diminishing, while silver prices drop further below the cost of production. Both seem unlikely but we shall see.
What is clear is that silver and gold are currently selling at bargain prices and the S&P is selling at very high prices. If the silver market has finally found a bottom then silver is – right now – an excellent investment, financial insurance, and protection for your purchasing power and savings.
For those who bought silver (and gold) at higher prices, the long-term trend is up and will eventually express itself. Waiting for the turnaround is painful, but now is a lousy time to lose sight of the “big picture” and sell at a loss. Instead, now is a far better time to buy.
If you bought silver at lower prices, you probably feel good knowing that your investment is currently profitable even at these post-crash levels. Further, silver prices are highly likely to increase substantially in the next few years.


Merk Insights
Switzerland: Vote Yes on Gold Initiative
Axel MerkMerk Hard Currency Fund
Posted Nov 12, 2014
On November 30th, the Swiss are voting whether to amend their country’s constitution on an initiative entitled ‘Save our Swiss Gold.’ The Swiss gold initiative appears widely misunderstood, both inside and outside of Switzerland. We discuss implications for gold, the Swiss franc and Switzerland as a whole.
The initiators of the gold initiative appeal to Swiss citizens desire not to sell out the ‘family silver.’ In the late 90’s, the Swiss National Bank (SNB) owned 2,590 tons of gold; since then 1,550 tons have been sold at prices far lower than today’s prices. While the Swiss might like their gold, they are fiercely independent. That’s relevant because by imposing a ceiling of the Swiss franc versus the euro, the SNB has de facto imposed the euro on Switzerland, a step closer to joining the euro – something many Swiss object to. More importantly, many Swiss may find it inappropriate for what is supposed to be an apolitical body like the SNB to impose policies with major political ramifications.
Not surprisingly, the Swiss government – which opposes the initiative - does not frame the discussion this way, but instead talks about the flexibility the SNB needs to implement its policies. It also points to the ‘losses’ incurred in 2013 when the price of gold fell.
Let’s look at the initiative and arguments in more detail. The initiative would amend Switzerland’s constitution such that:
- Gold reserves of the SNB must not be sold;
- Gold reserves of the SNB must be held in Switzerland;
- Gold reserves of the SNB must be ‘significant’ and must not fall below 20%.
- Switzerland has 2 years to repatriate its gold;
- Switzerland has 5 years to phase in the 20% reserve requirement.
The Swiss government states the SNB’s independence would be at risk if the initiative passed. Former Federal Reserve Chair Alan Greenspan had this to say about central bank independence: “I never said the central bank is independent.” He did not imply the government tells the Fed where to set policy on a daily basis, but made it clear that it is the government that sets the rules. He fought back against accusations that the Fed finances huge government deficits, arguing critics have it backwards, as the Fed merely goes along. He then added that the Fed’s policies are driven by ‘culture rather than economics.’
It should not be surprising that the Swiss government is against any outside restrictions imposed on the SNB, but not because it jeopardizes central bank independence, but because it reduces the flexibility the government has. But that, of course, is precisely the purpose of constitutional initiatives available in Switzerland.
Gold a risk for the SNB? The Swiss government claims that the sharp drop in gold prices in 2013 lead to heavy losses at the SNB. It’s sad when the official pamphlet representing the government’s view resorts to polemics. Let’s get a few things straight about central bank accounting:
- The gold held by the SNB was purchased at dramatically lower prices. If more gold were sold, no losses, but substantial gains would be recorded.
- In an effort to keep the Swiss franc from rising, the SNB has “printed” a great deal of money, as the chart below shows – almost as much as the Fed:
(Click on image to enlarge)
- Currency isn’t actually printed, but the Fed or SNB purchase securities from banks; they pay for these securities by crediting the account of banks with the stroke of a keyboard. Money is literally created ‘out of thin air.’
- What most are not aware of, however, is that the more money a modern central bank ‘prints,’ the more interest bearing securities it buys, the greater the “profit” of the central bank. That’s why central banks brag how ‘profitable’ their policies have been.
- However, while the Fed has only purchased domestic securities (US Treasuries and Mortgage Backed Securities), the Swiss National Bank has been buying Euro and U.S. dollar denominated securities. In doing so, the SNB has truly introduced massive currency risk.
- Except that central banks don’t really care about losses: the Bank of Israel, for example, has had a negative net worth for over 20 years. Losses for a central bank make for bad PR, but a central bank can simply ‘print’ money to pay for its obligations. Some central banks, such as the European Central Banks, have in their statues that member states must pay-in additional capital should the ECB suffer losses.
The Swiss government argues a central bank must be able to sell its gold in times of crisis. Let’s think about this: such a ‘crisis’ might occur when a bank is over-leveraged and must be rescued. To facilitate a ‘rescue’, the SNB is likely to provide “liquidity” (money printing with the promise that it’s only for the short-term). If a bank is insolvent rather than illiquid, it might require a capital injection. That capital has to come from somewhere. If gold is sold for this purpose, it is the people’s gold that’s being sold. The government likes to keep an option open to socialize losses.
We would argue that the very reason “too big to fail” exists is because governments play rescuers that are all too willing to sacrifice the wealth of the public. They say such measures are for the common good – because depositors might lose their money in a bank. Indeed, when a bank collapses, it is the savers that lose out, as the savers are the folks that have loaned money to the bank.
The way to protect savers, though, is through prudent policies that require those that take risks to be responsible for losses.
Gold is the people’s money
Gold is the people’s money, not the government’s money to splurge. If a currency is backed by gold, then the currency represents the gold. It’s not for the government to give away: that’s why the initiative argues against selling any of the gold, ever. It’s for that reason as well that the gold does not need to be kept abroad: gold is a store of value that ought to back the currency in circulation.
20% minimum backing of reserves
Marc Faber, for example, says he has been asked to publicly support the initiative, but has so far declined to do so because he argues it is a haphazard solution; only 100% backing would be worth supporting publicly. In our assessment, Marc is too quick in discarding the merits of the initiative. Combined with the requirement that the SNB will never, ever, be allowed to sell gold, there are major ramifications:
- Assume that 20% of the SNB’s assets are backed by gold and the price of gold drops. The SNB would be immediately required to purchase more gold. As such, over time, the SNB’s reserves would likely be above 20%. In our assessment, dynamics may well move them to be closer to 100% over time. Basically, whenever there is a crisis and the SNB might be tempted to ‘print money’ to bail out an institution, it would chip away at the SNB’s flexibility for future bailouts, more gold is held that cannot be sold.
- An activist SNB that continues to buy foreign securities may, over time, have a hard time defending a ceiling on its currency. That’s because a ceiling on its currency is akin to a bailout to the country (Switzerland) as a whole, arguing that debasing the currency is good for the country.
The Swiss government argues that the strong Swiss franc is a concern to exporters. No kidding. Other concerns are competitors – maybe we should get rid of those, too. And those pesky customers that don’t always feel like buying gadgets and services that are Swiss made. Kidding aside, we would argue that it is impossible for an advanced economy to compete on price. An advanced economy has to compete on value. Very few low-end consumer goods are exported from advanced economies.
Look at beer, as the one area where low advanced economies have tried to compete with what might be considered as a low-end product: first, beer is branded as a premium product these days. In order to have pricing power there has been massive consolidation in the brewing sector over recent decades in much of Europe; Switzerland has been left behind in this trend – but note that these are trends that have been firmly in place well before the financial crisis. A weaker Swiss franc wouldn’t fix these challenges. The alternative to scale is to then try to be profitable at the local level; indeed, microbreweries with no export market have succeeded in many high cost areas.
Swiss multi-nationals have long learned to have natural hedges in place, matching revenue and expenses in their export markets.
Switzerland usually retains the headquarters, possibly R&D. Switzerland has lots of seasonal workers; policy makers should think out of the box, such as paying seasonal workers in euros. It may be far better to pay workers in a depreciating currency than to throw away one’s gold reserves in order to attract more seasonal workers…
Switzerland has always had a tough market. It is said that because of how critical Swiss consumers are, that if someone can have a product succeed in Switzerland, it can succeed anywhere.
We live in a world drowning in debt. The U.S., European Union, Japan, to name a few, cannot afford to pay all the promises they have made. As Alan Greenspan recently said, a welfare state cannot support a gold standard. These other countries will debase their currencies over time in an effort to make their liabilities more affordable.
It won’t be easy to sell to countries that have put policies in place that we believe may impoverish their middle class. The solution, however, is not to impoverish Switzerland. It won’t be easy, but the sooner Switzerland embraces the reality that competitive devaluation is not in its interest, the better.
Back to reality
Having made the case for Switzerland’s gold initiative, note that passing the initiative would only be a first step. Unless policy makers embrace the spirit rather than the letter of the law, it may be an uphill battle. We have already received research reports how the SNB could circumvent its obligations by spinning off assets. The SNB might also engage in derivatives to undermine the spirit of the initiative should it pass.
Let’s also keep in mind that the SNB has five years to implement the 20% backing of its reserves by gold. That should allow the SNB to conduct purchases without disrupting markets. In the short-term, the signaling effect might be the most powerful one: the ceiling of the Swiss franc versus the euro may well get tested. Such ceilings are enforceable only when they represent an unconditional commitment. As soon as someone blinks, the market will test the resolve of policy makers. The passing of such tests may well qualify as resolve. The SNB may be well served to start buying gold from day one if they accelerate their purchases of euros.
Ultimately, people should never rely on their government to pursue a gold standard, but consider pursuing their own, personal gold standard. On that note, we will expand on our discussion of Switzerland’s vote to force the Swiss National Bank to hold a minimum of 20% of its reserves in our upcoming Webinar (click here to register), on November 20, 2014. As part of the webinar, we will also discuss how investors can build their personal gold standard.
Monday, 10 November 2014


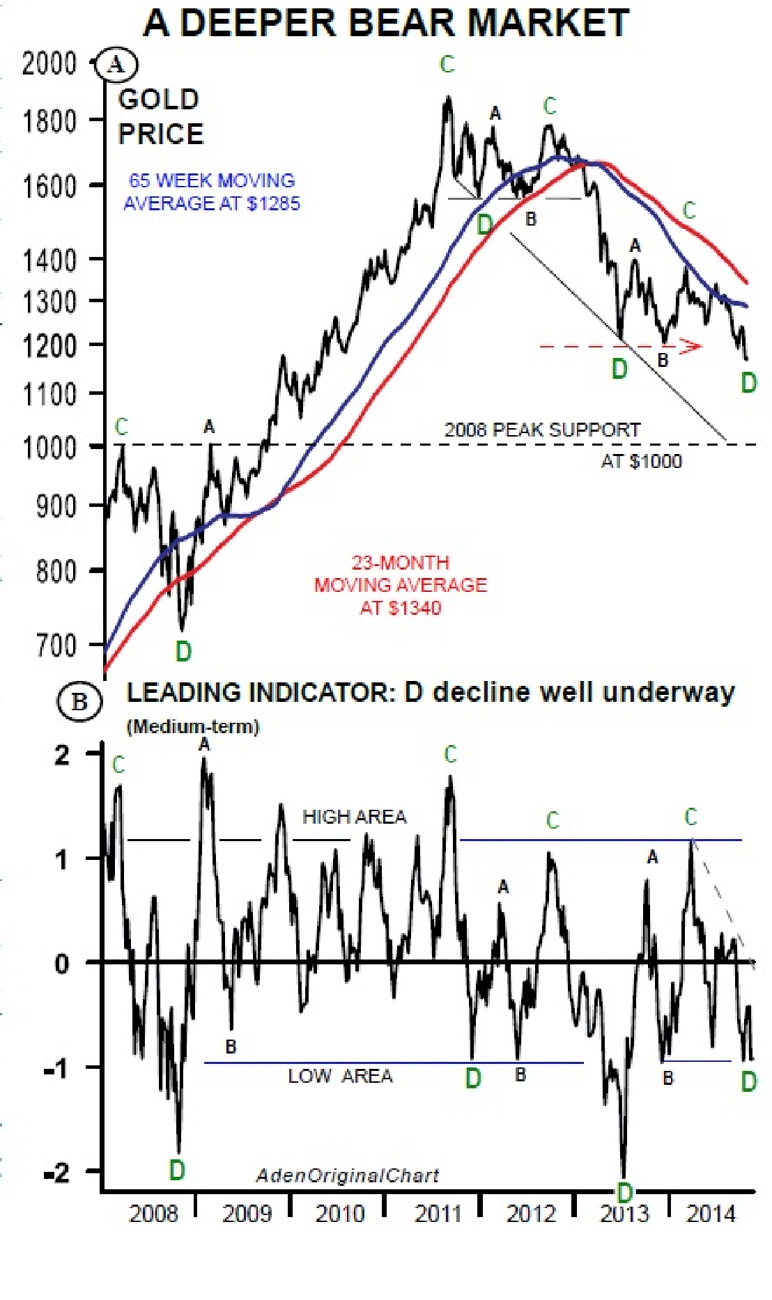
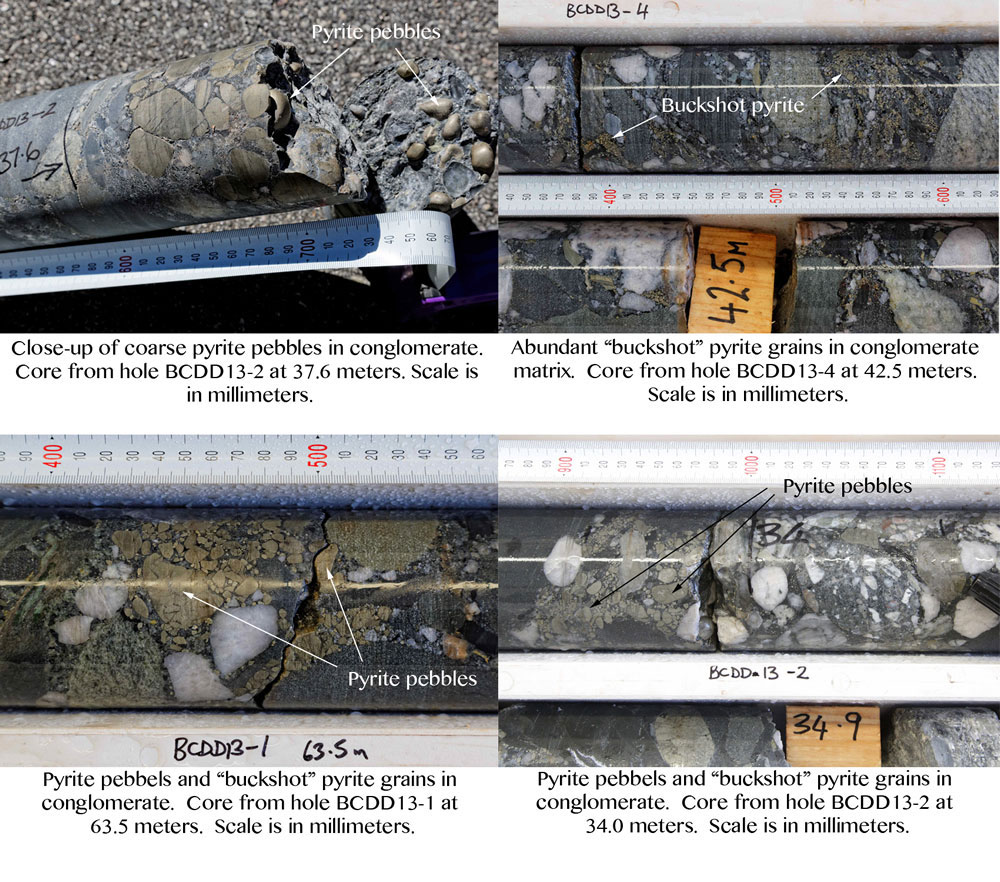
Welcome to our Fifth Anniversary Edition of The Gold Update: 260 of these weekly writings are now in the can, as is by our valuation, the price of Gold. When it comes to the beat-down of Gold during these last two years, we say "Enough is Enough!" Therefore, in order to shake up the joint a bit, dare I say,"knock a few heads together", we've decided to ramp up our part in championing rightly higher Gold prices with the above "in your face" new opening staple to these updates for the foreseeable future. And as we look at the scoreboard, with $1,179/oz. as the present Price, 'tis trailing Value -- $2,457/oz. -- by $1,278/oz. In fact, if you check in your Gold Press Guide, $1,179/oz. was the low for 2013.
Our sense is that if there is one money manager poised on the edge of the chair to materially delve back into Gold for one's clients, then there are thousands of like-minded money managers. Problematic is that they're all looking at one another to see who leaps first, for no one really knows "how low may become low". As an esteemed member of our Investors Roundtable exclaimed last Sunday, "Hell, it could go to 600!" That's were 'twas back in 1980, which if price was further diluted to account for the increased supply in Gold's tonnage over these last 34 years, essentially halves that level to 300.
Fortunately, we've not lost our common sense. Given that Gold unequivocally has been money forever, indeed that it has provably increased in value in its role as the de facto offset to accelerating foundationless currency supplies, let's commence with the following two charts. They both cover the last 34 years-to-date of weekly data for these three elements: 1) the change in the supply of the Federal Reserve Bank's M2 money supply, 2) the price of what we now refer to as "Gold D&D" -- its valuationDiluted for its increase in tonnage supply as adjusted for the Debasing of the Dollar by the increase in M2 -- and 3) the price of Gold itself.
The first chart (Price Level) puts M2 on the left-hand axis vs. both "Gold D&D" and Gold itself on the right-hand axis. Thus as displayed in our opening scoreboard, even diluting the price of Gold to account for its increased tonnage supply over these better than three decades, as offset by the level of M2, price today "ought" be $2,457/oz.:
The second chart below (Percentage Change) tracks the same three elements, but all on the same scale. Even given Gold's supply increase, such diluted percentage change when including accounting for the debasing of the money supply is only half of that of M2's percentage change, making all the more absolute the fact that Gold today "ought" be double what presently 'tis:
I know, 'tis all too logical, even as supported by mathematical science, (aka "Truth"). But because at the end of the day, Gold's actual price is demand driven, for which there is a complete dearth, 'tis therefore apathetically -- and thus pathetically -- priced at about half its value. And yet, when the great game of Money Manager Chicken suddenly stops and they all start piling back into Gold funds, Gold stocks, Gold derivatives and Gold bars/ingots/coins, Gold shall, per our favourite of market technical analysis expressions, go Upside Gonzo Nuts ("UGN").
And maybe, just maybe, 'twill be our Swiss friends that get Gold a-rallyin'. For as you studied readers are likely aware, the Swiss in taking to the polls on 30 November have a ballot measure, which if victorious, would charge Die Schweizerische Nationalbank with maintaining at least 20% of its assets in Gold, moreover that Die Bank be forbidden to sell any Gold, and further that Die Bank repatriate any Gold that its owns outside of God's Country. We have to think that passage of this measure surely would be a global reminder toward again valuing Gold as real money, in turn launching it back into First Place in our BEGOS Markets Standings, which year-to-date are as follows and really reflect the short-sighted yearn for Dollar-based paper assets, rather than for Gold:
And speaking of Switzerland, I heard their Marc Faber (via Bloomy) this past week referring to "foolish analysts" pointing to economic strength when the reality is that Oil's plummeting -- as you can see in the above standings 'tis in last place -- is telling us anything but. Then couple that with the Bond leading the BEGOS bunch -- but the S&P's just having closed yesterday (Friday) for the 38th time this year at an all-time high -- and you don't think we're on absolute "crash watch"? Oh yes.
As for the consumer, whose spending drives the lion's share of the economy, a retail analyst noted this week that holiday budgets are tight and that they'll be spent earlier in the shopping season rather than later. Indeed, 'twas reported yesterday that Consumer Credit rose in September for the 26th consecutive month -- and the Fed's mulling over raising rates next year? Woe to those in variable debt throes.
As for the Stateside Baro, 'tis essentially noodling about sideways as the S&P seemingly ignores it...
...whilst across the pond the European Commission cut its growth forecasts for the EuroZone, with added anxiety from the German economy teetering on tipping into recession and the European Central Bank ready to increase stimulus; the Bank of England, too, sees the UK's economic recovery as ebbing; a week ago we discussed Japan's rising sun as sinking; and now we've China's factory output slowing. So, this being a landmark edition for The Gold Update, we again justifiably quote the sole recipient of the very first missive five years ago, JGS: "Sumpthin's gonna happen..." Exactly right, my friend. And I sense the ever-illusive When is streaking toward us.
As for Gold, which after leading the BEGOS standings through the first two quarters of 2014 has now dropped into third place to be -2.2% year-to-date, it put on quite the resilient display yesterday in making back four days of flailing below last year's low, (as we'll later see into newly treacherous territory for our Gold Structure chart). But specific below to this next graphic, although the week's overall change was immaterially higher, yesterday alone was Gold's strongest up day since 19 June, rising better than 3% or 37 points. And given the week's contract volume was the heaviest since that ending 19 April2013, we may well look back on this as Gold's capitulative low. After all, you may recall, last week's missive was entitled: “Gold Is Now WAY Oversold”:
"Well, mmb, you did show us how far away gold got from that magnet thing. Happy 5th by the way..."
Thank you, Squire, 'tis grand to have you aboard in this anniversary edition. And yes, Gold was attracted back to its Market Magnet in full yesterday, as we see below in the left-hand panel's three month chart. Also below in the right-hand panel's one year chart of Gold's "expected daily trading range", we finallysee Gold getting into the seasonal spirit of volatility, the box indicating 20 points expected between the daily high and low prices, and thus quite the Golden playing field for you traders out there:
Next, we've another double-barrel Gold Display. Below on the left are Gold's daily bars for the last three months-to-date with the "Baby Blues" dropping like a stone; but should yesterday's "power bar" mark a capitulative low, the Blues shall soon turn up in tow. Below on the right is the 10-day Market Profile for Gold, the current 1179 price essentially centered between two major trading resistors above at 1204 and 1229, and two major trading supporters beneath at 1168 and 1144:
And now for the grand finale. When we last posted the Gold Structure graphic, (20 September edition), 'twas noted as follows: "...we don't wish to have to create a further sub-structure for the chart in orangy-red defined as Gold having gone to 'you-know-where'..." To so do would require Gold busting its low for 2013 of 1179, which it did one week ago. And thus as we turn to the updated Gold Structure of price's weekly bars since the All-Time High of 1923 on 06 September 2011, we've dutifully added the devilish layer:
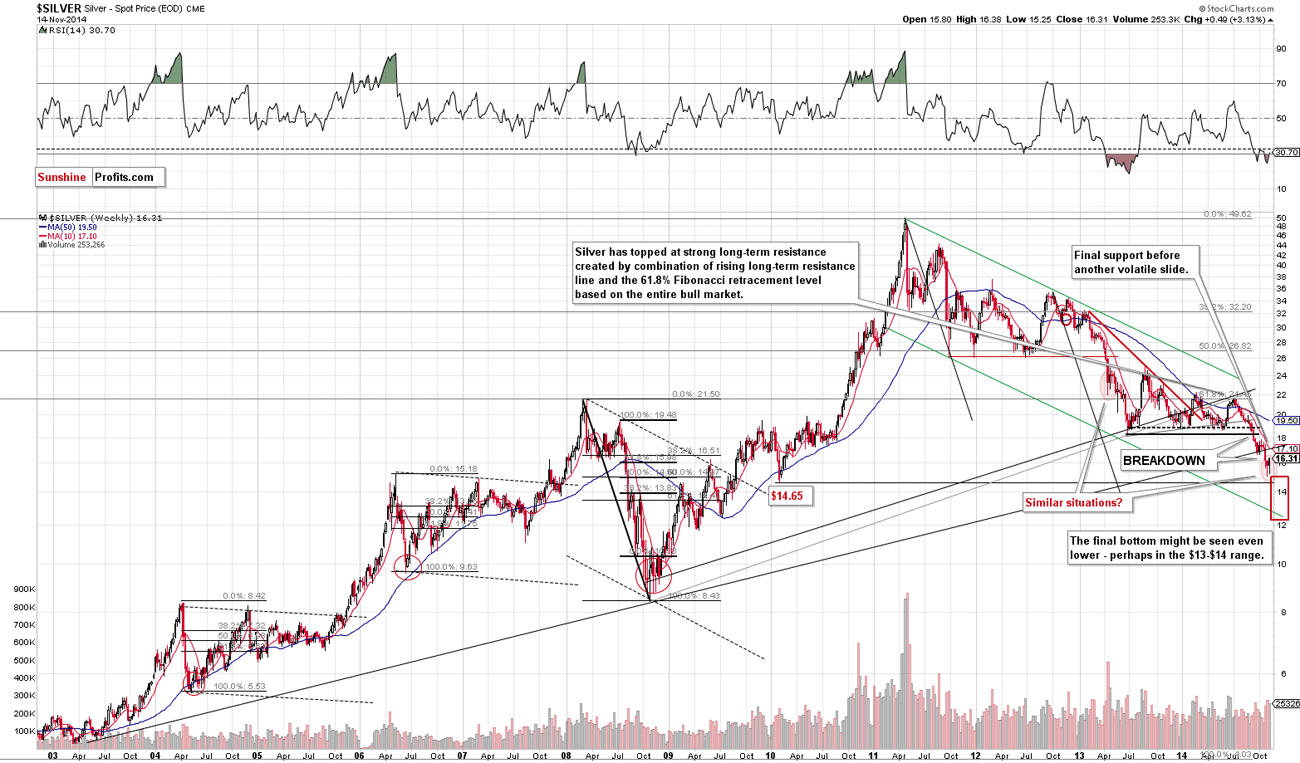
In closing, we can't wrap up this anniversary edition without a mention for poor ole Sister Silver, who as you saw above in the BEGOS Market Standings has been absolutely clobbered this year, (-18.6% vs. just -2.2% for Gold). In fact, you may recall from a week ago that she'd been seen hocking her precious metal pinstripes at the local pawnbroker, just to get lunch money. Well, cheer up Sis, per this "above the fold" headline that ran in the FinMedia on Thursday: "American Eagle Silver Coins Sold Out as Demand Jumps ... The U.S. Mint ran out of American Eagle silver coins after selling 1.26 million ounces since the start of the month as futures in New York slumped to the lowest in more than four years." You've got a lot of smart folks routin' for ya, Baby! Clearly by our reckonin', 'tis time for you to join Gold in putting some more points up on the scoreboard!
Cheers and Thanks to You ~The Readers~ for your Interest these Five Years! Onwards and UPWARDS!
...m...


Novo’s Latest News
Bob MoriartyArchives
Nov 10, 2014
I have written at some considerable length about Novo’s Witwatersrandlookalike gold project in Western Australia. Rather than rehash what I have repeated again and again, I suggest interested readers go back and read what I have written before.
I went to visit the Nullagine gold project of Novo at the end of September. The company is finishing up a series of 353 RC holes. In addition they have completed over 400 surface samples. When Novo ran the last set of drill holes a year ago, management was disappointed with the results because they didn’t correlate with the results they had been getting from prior drilling and had expected.
Novo and Newmont put their heads together to figure out what the problem was. Results from 115 years ago in the Nullagine gold district showed between 10 g/t up to 60 g/t gold. Novo was doing something wrong to get the results they got.
(Click on images to enlarge)
At the end of the brainstorming between Novo and Newmont, they concluded the low grades were a result of the “nugget effect” and for more accurate results, hopefully higher, they needed to be assaying much larger samples. The drill samples will be 20 kilos; the surface or costean samples will total 40 kilos.
The surface samples are far more important than they would be at most deposits. They represent exactly what will be mined and are large enough to represent exactly the grade Novo will be mining. They do not measure indications of gold; they measure what will be produced.
On this trip to a much greater extent than I had seen on my first two trips to the Pilbara, I saw the impact of the bacterial remobilization of gold as reflected in the amount of buckshot pyrite.
Certain bacteria or microorganisms attract sulfides and gold associated with those sulfides and cause the gold to precipitate out of solution. This happened 2.3 billion years ago as the Pilbara conglomerates were creating the basin and it happens today.
This paper talks about the action of the bacteria. It’s written in Sanskrit but is a lot more readable than most reports.
Microorganisms capable of actively solubilizing and precipitating gold appear to play a larger role in the biogeochemical cycling of gold than previously believed. Recent research suggests that bacteria and archaea are involved in every step of the biogeochemical cycle of gold, from the formation of primary mineralization in hydrothermal and deep subsurface systems to its solubilization, dispersion and re concentration as secondary gold under surface conditions.Few geologists actually understand the mobility of gold either through chemical action or through bacterial action. If you go deep in the heart of the Amazon you will find giant gold deposits associated with deeply weathered laterite over less weathered saprolites. The Amazon jungle consists of three types of ground and vegetation, that which is always under water, that which is under water during the rainy season and that which is never under water.
Enzymatically catalysed precipitation of gold has been observed in thermophilic and hyperthermophilic bacteria and archaea (for example, Thermotoga maritime, Pyrobaculum islandicum), and their activity led to the formation of gold- and silver-bearing sinters in New Zealand’s hot spring systems. Sulphatereducing bacteria (SRB), for example, Desulfovibrio sp., may be involved in the formation of goldbearing sulphide minerals in deep subsurface environments; over geological timescales this may contribute to the formation of economic deposits. Iron- and sulphur-oxidizing bacteria (for example, Acidothiobacillus ferrooxidans, A. thiooxidans) are known to breakdown gold-hosting sulphide minerals in zones of primary mineralization, and release associated gold in the process. These and other bacteria (for example, actinobacteria) produce thiosulphate, which is known to oxidize gold and form stable, transportable complexes.
The regular seasonal rains change the chemistry of the soil and gold will precipitate from the sulfides below the saprolites. There will be very coarse visible gold at surface. As the miners went deeper, the visible gold got smaller and smaller. As they go below the laterite layer into the saprolite layer, the gold is only found with sulphides and is so small that it is invisible.
The same is true in Northern California in peach orchards. When farmers pull up dead trees, they often find small gold nuggets at the end of the roots where the cyanide from the tree has attracted gold in the soil to form a nugget. [Editor’s note: Peach farmers might want to put very high fences around their orchards now that Bob’s let the cat out of the bag.]
To test his theory and to see the size of the gold near surface, Quinton shipped a small impact crusher to Nullagine. I got to be there when he first tested it. The “experts” played around with it for 30 minutes before giving up on their ability to start the “bloody contraption.” I saved the day by finding the fuel and choke controls and moving them into the operating position. Then it started on the first pull.
When I was there we broke up a bunch of the near surface conglomerate and fed it into the machine. I’d guess we put in about 25 pounds or around 12 kilos, similar to what Quinton would test later. The machine worked as advertised and we panned the output of the crusher. Granted, we did high grade the material by selecting only the badly pockmarked rock with holes where the buckshot pyrite had been.
I showed right at 1.1 grams in the gold I brought home. If you figure 80 times that to make a tonne, you would have three-ounce material. Even the old-timers would have some dilution so our grade would be similar to what they got 115 years ago.
Quinton tested 12 kilos of material and the photo below is what he got. A side benefit of the test showed the gold to be fairly large for placer so gravity will work. The latest press release showed similar results in the lab ranging from 71% to 92.7% recovery. That makes mining this material very cheap, perhaps one of the cheapest mines in the world.
The Nullagine gold project consists of a number of layers of conglomerate. Quinton wants to select the highest-grade layers, near surface for mining. He wants to scrape off the waste rock and only mine the high grade. By being very selective of what he mines, Novo can produce a lot of gold without milling a lot of material. 115 years ago, the miners were doing one ounce plus material. Quinton doesn’t intend to be quite that selective but it will be high-grade material that can be processed very cheaply.
I view my trip as being very productive. I got to see exactly where the gold was and how it got there. The conditions in the Pilbara right now are abysmal. Quinton was whining about 45-degree temperatures and eventually I realized he was talking centigrade, not Fahrenheit. 45 decrees C is about 113 F in the shade and there isn’t any shade. That’s bloody hot. The shares have gotten hammered due to Pinetree dumping everything in their inventory and the market in general but they are back to being pretty darned cheap.
Quinton’s intentions are to get into production as soon as possible. He intends to have the feasibility study completed by mid-2015. After that, Millennium Minerals has to start kicking in 30%. The BLEG work hasn’t all come in yet but what Newmont has released shows the current area as the most gold productive.
I think the deep holes could be a game changer. Quinton believes the periphery of the basin is where the most biological remobilization would have taken place but I suspect there will have been a lot of chemical remobilization taking place in the deeper sections. Only drilling will tell the whole story. Those results are 6-7 weeks out.
I own shares; I have participated in every PP. I am biased as I can be. Please take some responsibility for your own actions.
Subscribe to:
Posts
(
Atom
)