This is featured post 2 title
Replace these every slider sentences with your featured post descriptions.Go to Blogger edit html and find these sentences.Now replace these with your own descriptions.This theme is Bloggerized by Lasantha - Premiumbloggertemplates.com.
This is featured post 3 title
Replace these every slider sentences with your featured post descriptions.Go to Blogger edit html and find these sentences.Now replace these with your own descriptions.This theme is Bloggerized by Lasantha - Premiumbloggertemplates.com.
Monday, 24 November 2014
22:27
Unknown
Gold prices ended the U.S. day session steady to modestly lower Monday. The yellow metal did move up from its daily lows by the close, as the U.S. dollar index moved below unchanged to its daily low. February Comex gold was last down $0.70 at $1,197.70 an ounce. Spot gold was last down $4.80 at $1,197.75. March Comex silver last traded up $0.011 at $16.47 an ounce.
U.S. stock indexes were firmer to start the trading week and hovering near their recent record or multi-year highs. The major bull run in equities worldwide is a major negative for the competing asset class raw commodities, including precious metals.
Bulls continue to find it very difficult to shake off the negative impact of a stronger U.S. dollar against the other major world currencies. The U.S. dollar index notched another four-year high in overnight trading, before some mild profit taking set in during the U.S. trading session.
It could be a quieter trading week in the U.S. as the Thanksgiving holiday is Thursday.
European shares rallied overnight on the lingering bullish impact of fresh monetary stimulus announced by the European Central Bank late last week. Most world stock market bulls were also cheered by Friday’s surprise monetary policy easing by China’s central bank. With the world’s major economies awash in liquidity, the stock markets have been the main beneficiaries of such. But many veteran market watchers remain worried about the specter of problematic price inflation arising at some point down the road. I would be very surprised to find that years of very easy money policies by the major central banks find their economies going unpunished for such.
In overnight news the closely watched German Ifo Institute’s business confidence survey showed a rise to 104.7 in November from 103.2 in October. This was the first rise in months. The market place expected a reading of 103.0.
The market place is looking ahead to Thursday’s OPEC meeting. Some believe the beleaguered oil cartel could reduce its overall daily oil production quota, or at least call for strict adherence to existing quotas, most of which are ignored by OPEC nations. Nymex crude oil futures are trading not far above the recent three-year low. This could be a “make-or-break meeting for OPEC. Saudi Arabia and Iran will be the key players at the OPEC meeting.
The much-anticipated Swiss gold referendum vote is on Nov. 30. The “Save Our Gold” measure would require the Swiss National Bank to hold 20% of its assets in gold reserves. Early polls suggest the measure will not pass.
The London P.M. gold fix was $1,197.50 versus the previous London A.M. fixing of $1,196.00.
Technically, February gold futures prices closed near mid-range. Bears still have the overall near-term technical advantage. Prices are in a 4.5-month-old downtrend on the daily bar chart. However, the bulls are working on establishing a near-term uptrend from the November low. The gold bulls’ next upside near-term price breakout objective is to produce a close above solid technical resistance at $1,225.00. Bears' next near-term downside breakout price objective is closing prices below solid technical support at last week’s low of $1,174.70. First resistance is seen at $1,200.00 and then at today’s high of $1,204.50. First support is seen at today’s low of $1,192.80 and then at Friday’s low of $1,186.70. Wyckoff’s Market Rating: 3.0
March silver futures prices closed nearer the session high. The silver bears have the overall near-term technical advantage. Prices are in a four-month-old downtrend on the daily bar chart. However, the bulls are working on establishing a near-term price uptrend from the November low. Silver bulls’ next upside price breakout objective is closing prices above solid technical resistance at $17.00 an ounce. The next downside price breakout objective for the bears is closing prices below solid support at the November low of $15.085. First resistance is seen at last week’s high of $16.66 and then at $16.715. Next support is seen at Friday’s low of $16.16 and then at $16.00. Wyckoff's Market Rating: 2.5.
March N.Y. copper closed down 220 points at 300.70 cents today. Prices closed nearer the session low. The bears have the near-term technical advantage. Copper bulls' next upside breakout objective is pushing and closing prices above solid technical resistance at last week’s high of 307.20 cents. The next downside price breakout objective for the bears is closing prices below solid technical support at the October low of 295.00 cents. First resistance is seen at 302.50 cents and then at today’s high of 304.55 cents. First support is seen at 300.00 cents and then at 299.15 cents. Wyckoff's Market Rating: 2.5.
22:26
Unknown
Certain Uncertainty
After trying to hold the $1200 level, gold has shied back and is hovering right below that psychological mark. The continued strength in equities has helped limit gold’s upside, although silver, due to industrial factors, found a tiny bit of power – well, a spark, is more like it.
Some of the uncertainty in gold is the nature of this week’s holiday aura. It is a short trading week in the United States. Formally, Thursday is the holiday, but Wednesday and Friday will end up being lighter days in New York trading because people tend to slip out early Wednesday and simply not work on Friday.
That should make gold enthusiasts wary, though, because any large move may inject volatility into the pricing of precious metals. Friday – and therefore Wednesday – is the end of the month, so accounts may be squared up ahead of Thanksgiving.
Tuesday will give us two economic indicator readings. U.S. leading economic indicators and consumer confidence reports are due out, and while the former may show some wavering on growth, the latter will probably at least hold steady. But, the uncertainty will hold back any bold moves until the dust from the gauges’ release settles.
An unexpected surge in business sentiment in Germany also gave some strength to the euro, sending the dollar down and lending support to the price of gold.
What, exactly, the European Central Bank will do regarding stimulus still remains a mystery. If they are serious about pushing the union’s economy over the top, that will probably mean renewed strength for the dollar, and therefore lower gold prices.
Also adding uncertainty is the Swiss referendum concerning the mandating of a certain amount of its reserves in physical gold. While the amount seems indeterminate at this point, the actual amount in dollars will not be far off the amount, by percentage held by other major western economies. So, this seems to us a tempest in a teapot.
One last element of volatility remains on our radar: Ukraine and the Russian invasions of that country’s territory. Today, another former Russian-dominated country, Lithuania, offered military assistance to Ukraine. While Lithuania is a small country with limited military resources, it is a member of NATO.
22:25
Unknown
SETTING THE STAGE FOR THE NEXT RECESSION
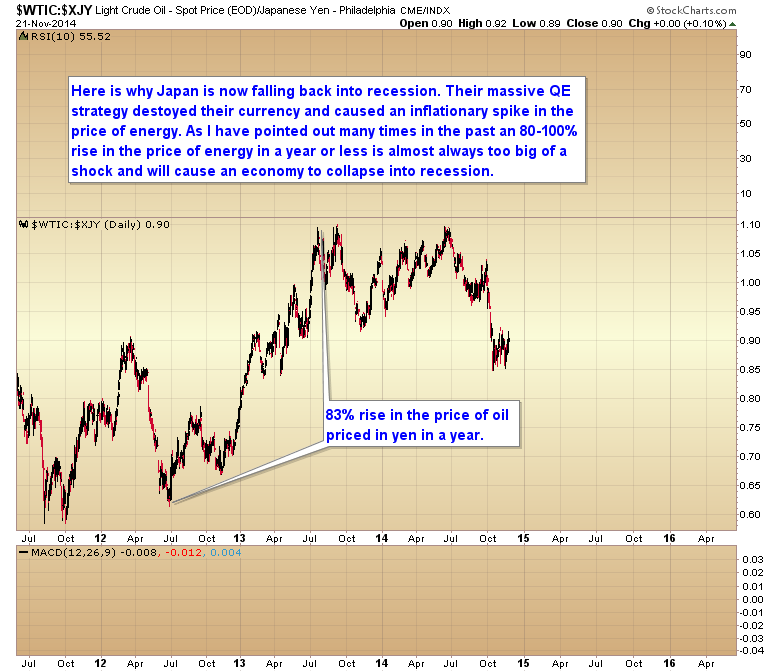
After two years of insane money printing designed to rescue its failing economy, Japan has now been rewarded with… another recession.
So what went wrong you ask? The same thing that always goes wrong when a central bank resorts to money printing to rescue an economy instead of allowing a cleansing period and a return to real productive growth. All they accomplished with their massive QE program was to spike inflation.
As I have pointed out many times in the past, any time the price of energy spikes 80-100% within a short period of time it will almost always cause a recession. As you can see on the chart below when Japan began their foolish money printing campaign it spiked the price of oil 83% as priced in yen. Add to that the increase in sales tax and ultimately this was just too much for the Japanese economy to withstand, and it has now turned back down into another recession.
Unfortunately all the pieces are falling into place for the Federal Reserve to follow the precedent of the Bank of Japan and ultimately push the US into the next recession. How is that you ask? The economy seems to be rolling along fairly steadily here in the United States.
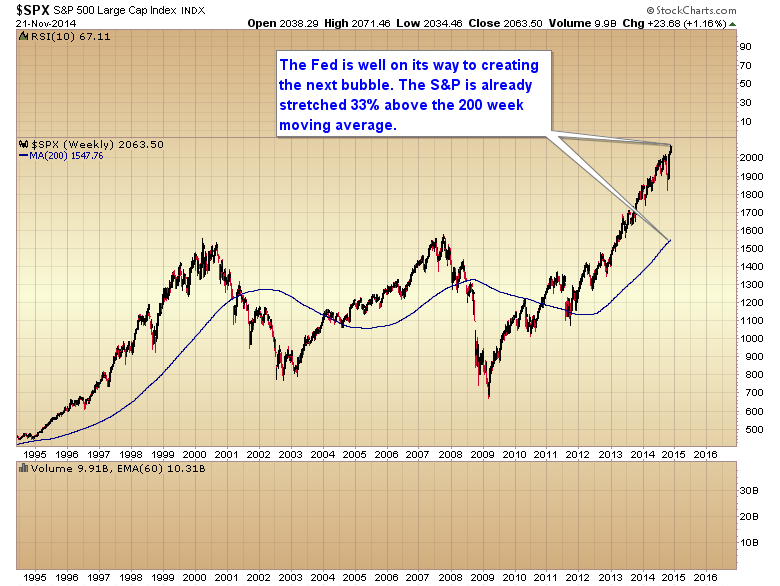
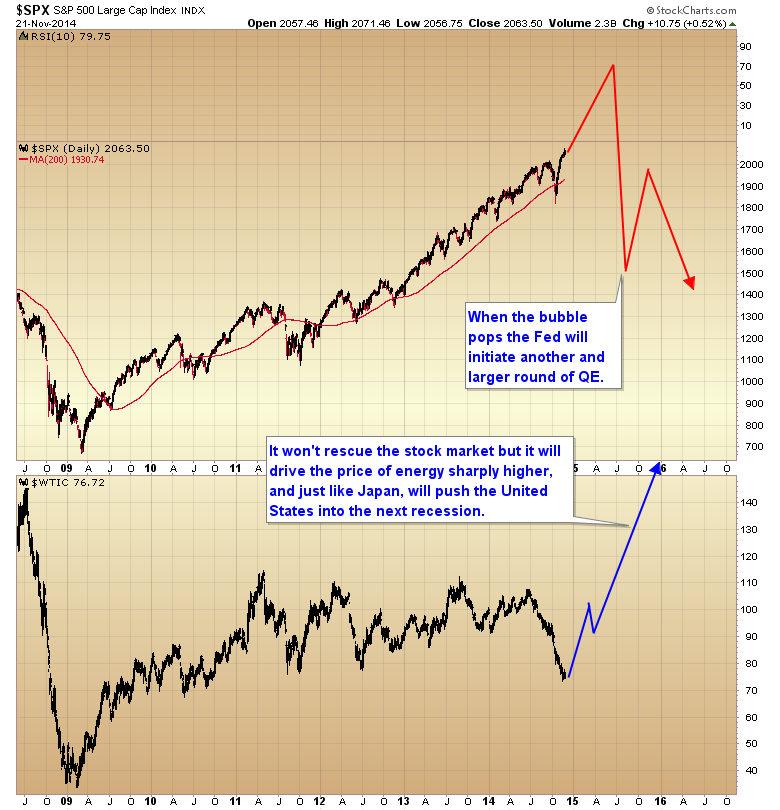
It always starts with the bubble. In the short run Keynesian economic policies work, but the end result is that they create bubbles. In 2000 we had a tech bubble. In 2005/06 we had a real estate bubble. In 2008 we had a bubble in oil and a severe inflationary event (which of course led to a recession). And now in 2014 we are beginning the initial stages of the next bubble. Notice in the chart below that the S&P is now stretched 33% above its 200 week moving average.
Notice how we have very similar conditions to the 1998 period. In 98 the Fed rescued LTCM and sent the signal to the market that the Greenspan put was in place. The market recovered very quickly from the sharp correction and then entered an orgy of speculation with the knowledge that Greenspan would protect the stock market against any serious declines. That culminated in the NASDAQ bubble.
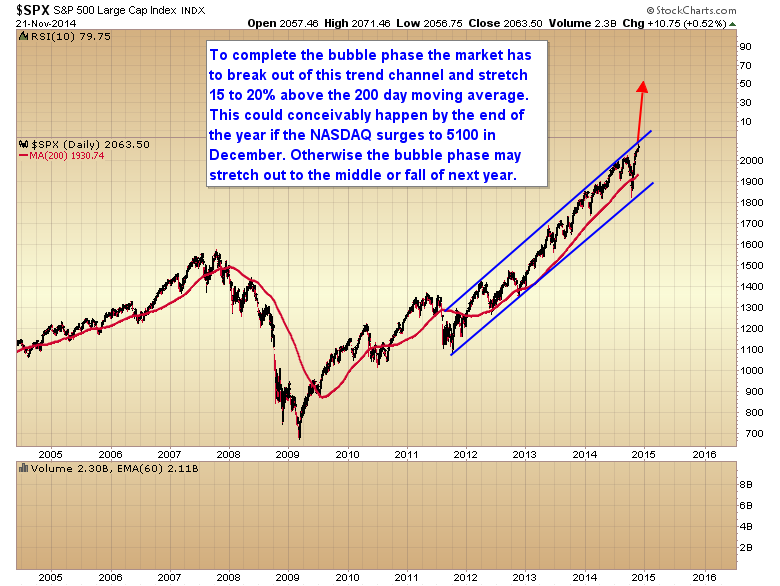
In October the stock market suffered another sharp correction similar to 1998 and again the Fed sent signals that they would restart QE if needed. This caused the market to slingshot back to new highs, and I believe we are now beginning the initial bubble phase that will culminate with the S&P breaking out of its two-year trend channel, and stretching 15-20% above its 200 day moving average. There is even a possibility this could happen quickly if the NASDAQ were to surge straight up to 5100 in the month of December. Otherwise it may take longer and we get our final top sometime next year. Either way, for a bubble to form the market has to stretch a long ways above the 200 day moving average. That is the confirmation that a bubble has formed. We don’t have that yet, and until we do I don’t think we can have a final bull market top.
So how does this cause a recession you ask?
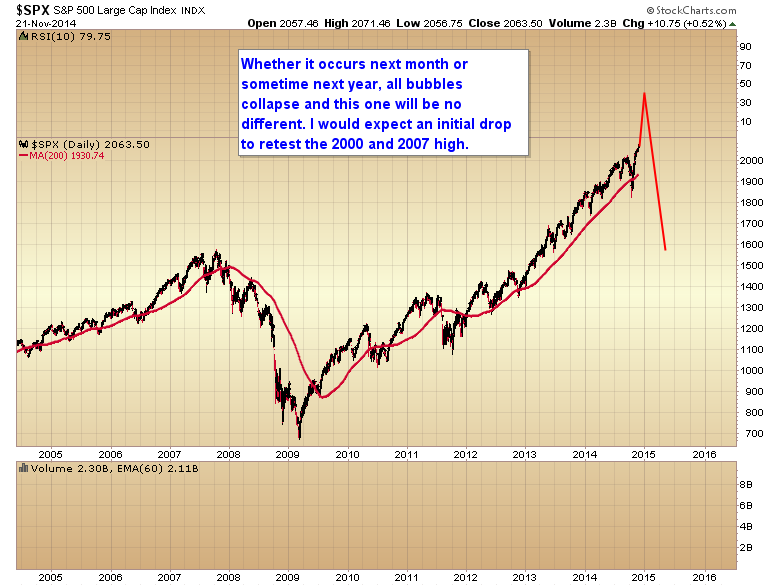
Let me show you how I think this is going to play out in the months and years ahead. At this point the bubble in the stock market is probably unstoppable. The mistakes have already been made and QE to the tune of multiple trillions of dollars is going to have consequences. The bubble in the stock market will continue to rise and grow, until like all bubbles it pops. This is where the plot thickens. I expect the initial crash will take stocks back down to retest the 2000 and 2007 high. I’ve drawn the chart below with the bubble phase occurring next month, but like I said this could easily stretch out into the middle or even fall of next year before the bubble pops. I’ve noted before that it often takes eight months to a year for a bubble to develop and pop. That’s about how long it takes for the public to catch on and every last buyer to enter the market. If we assume that the bubble began at the October low then we could conceivably see this continue until next fall.
Once the bubble pops we all know what the Feds response is going to be. They are going to restart QE and print money at an absolutely mind-boggling rate to try and reflate asset markets. The problem is when a bubble pops, and a parabola collapses, nothing the Fed can do will rescue it. The inflation will come out of stocks and look for something else to land on. Just like it did in 2008 when the stock market topped, the inflation is going to move into the commodity markets, and it will without doubt spike the price of energy at least 100% in a year causing the US economy to follow Japan down into the next recession.
This end game has been unavoidable and unstoppable ever sense the Fed began QE3. When Bullard and Williams went public in mid-October to reassure the markets that more QE would be delivered if needed, it initiated the beginning of the final parabolic bubble phase in the stock market. Now it’s just a question of when will the bubble pop and the terrible consequences of these insane monetary policies begin?
22:24
Unknown
This past week in gold
Jack Chan***
***
***
***
CEF – on buy signal.
***
Summary
Long term – on major sell signal since Mar 2012 when $HUI was at 550.
Short term – on buy signals.
Gold sector cycle – up as of 11/14.
COT data suggests a major bottom is not in yet for the metals.
22:23
Unknown
The Stealth Bull Market in Gold
Bob MoriartyRight under the nose of skeptical investors gold and silver resource shares have been in a wild rally for nearly three weeks. Since early November, the XAU rose 12.38 points or over 20%. The HUI rose 29.42 points for a 20% gain and the GDXJ soared by 29%. All while bruised and battered investors were crying into their beer.
As Rick Rule recently said, you need to buy into fear and sell into complacency. Investors in resources are terrified; investors in the DOW and bonds are complacent. Do they really think the DOW is going up for the next five years in the same way it did the last five years? Do they think bonds are going to the moon? They have already gone to the moon and gravity is about to take effect.
I missed a real opportunity two years ago when I talked to the management of Enterprise Group (E-V) early in 2013. The stock was about $.24 a share. They had a model of buying small companies in the energy space in Alberta and needed attention. We never came to any kind of agreement, they wanted to pay in options and I don’t like doing that.
The shares went from $.12 in 2012 to $1.20 in two years. One of the brains behind Enterprise determined he should copy their business model so he built another company with a similar business plan. I paid a lot more attention this time. The company just got listed.
QE2 Acquisition Corporation (QE-V) buys and develops small and well managed, asset backed infrastructure and utility service businesses in Alberta. They are going to integrate these businesses both vertically and horizontally to add synergy and reduce costs. Their timing couldn’t possibly be better.
QE2 is a new company literally designed around the same game plan as Enterprise Group. They began trading on the 5th of November, which just happened to be when the HUI and XAU hit their low points, and you couldn’t give away resource shares.
The CEO of QE2, Mike Belantis, has 15 years experience in investing and consulting both public and private companies. He is doing nothing more than copying the Enterprise model. The COO of the Enterprise Group, Dug Bachman, recently joined the Board of Directors of QE2. Enterprise managed to increase their revenue by 150% in the last year.
Actually with the recent decline in the price of oil, QE2 is even better positioned to enter the energy space than was Enterprise. The price of oil is down from where it was six months ago but so are the prices for buying energy related and infrastructure companies.
For the last 20 years, Alberta grew faster than any other province in Canada. The government is aggressive in their plan to continue building infrastructure. Alberta government figures show the economic expansion for 2014 should grow above 3.3% after four straight years of growth above 3%.
QE2 purchased Pillar Contracting in late 2013. Pillar has been operating in Alberta for over 16 years installing street lighting and post painting services. Street lighting sounds like one of those businesses that make you want to snore, but given the energy impact of LED lighting it’s the place to be right now. LED lights cost more money but use 20-30% of the energy of the bulbs they replace and last far longer. Communities are waking up to the incredible cost savings they can make by installing LED light bulbs.
In 2013, Pillar grossed over $3.7 million and netted about $500,000. QE2 anticipates building the company to $6.6 million in sales in three years and doubling earnings. The company may expand their services into neighboring provinces, Saskatchewan and Manitoba.
QE2’s latest acquisition is the Candesto Enterprises Company. Candesto assembles and installs highway signs. They also build guardrails and install fencing. QE2 bought them in April of 2014. The company has a 20-year operating history and management is willing to stay an additional five years to provide continuity.
In 2013 Candesto did $4.4 million in sales and earned over $1.5 million. Given their efficiency and experience any potential direct competitors are likely to subcontract with Candesto.
QE2 aims to grow both organically and through acquisitions. Their goal is to grow revenue to $100 million by 2018. They will be free cash flow positive in 2015. You can expect to see new companies being brought into the QE2 fold on a regular basis.
The economy of the world operates on a foundation of carbon-based energy. For all the smoke and mirrors about alternative energy sources, they remain a 3% solution. We need oil. I believe the new normal range for the price of oil is $75 to $100 and potentially higher given some of the possible black swans. Alberta is growing and will continue to grow and to expand infrastructure for the foreseeable future.
QE2 has a tiny 28.5 million shares outstanding with an additional six million warrants at $.50. With the shares at $.15 as of last Friday, naturally $.50 warrants are non-dilutive. With a $4.3 million dollar market cap, for the share price only the sky is the limit.
There is a giant opportunity in QE2 right now similar to that of the HUI and XAU in early November. One overseas shareholder needs to sell shares. He sold into an illiquid market on Thursday and Friday of last week and cratered the shares from $.20 to $.15, down some 25% in two days. It’s an individual shareholder issue, not a company issue. I expect the shares to rebound just as soon as the remaining shares are sucked up. So if you like the company you may want to put in a stink bid and hope that you get filled.
I missed the opportunity of investing in Enterprise. I don’t intend to miss the opportunity to invest in QE2. I just learned over the weekend about the shares being dumped and literally the market hasn’t been open to buy shares yet.
Sunday, 23 November 2014
22:03
Unknown
Workers Finish Recovering MH17 Wreckage In Ukraine
PELAHIIVKA, Ukraine (AP) — Workers have finished recovering wreckage from the Malaysia Airlines Flight 17 disaster, more than four months after the passenger jet was shot down over rebel-held eastern Ukraine.
Under the supervision of Dutch investigators and European security officials, the recovered fragments were loaded onto a train in the village of Pelahiivka and shipped to the Ukrainian government-held city of Kharkiv on Sunday.
The investigation into what happened to MH17 is being conducted there and in the Netherlands. Ukraine and Western governments accuse Russia-backed separatist fighters of firing rockets that felled the plane, killing all 298 people aboard, while Russian state-run TV has blamed Ukraine's air force.
The recovery operation, which took a week, had been delayed because of continued fighting between government troops and separatist fighters despite a cease-fire agreement reached in September.
A volley of rockets hit a residential district Saturday evening in western Donetsk, the main rebel-held city, injuring at least one resident.
"A Grad rocket came through the roof, hit the ceiling and then ... finally embedded itself in the floor," Vladimir Goryanskiy said Sunday. "It was yesterday. My wife was sitting close to it and only a miracle saved her. Her arm was broken and she suffered a cut tendon and some other cuts."
Ukrainian forces have firing positions to the north and west of this neighborhood in the Kuibyshivskyi district. Outgoing fire also was heard Saturday evening. Shelling has hit the working-class neighborhood before, and several homes are now empty because residents have moved to safer areas.
22:03
Unknown
Next Week's OPEC Meeting, Eurozone Data Gives Gold Much To Consider
By Debbie Carlson
The gold market has a full plate next week: there’s a major meeting of the Organization of Petroleum Exporting Countries, inflation data out of the eurozone, and a major holiday in the U.S. to keep volatility high.
|
Gold could see some mercurial trade to start off the week as Comex December gold options expire on Monday, adding another dimension to the week’s action. The market may also see some last-minute positioning ahead of the Nov. 30 Swiss gold referendum.
December gold futures rose Friday, settling at $1,197.70 an ounce on the Comex division of the New York Mercantile Exchange, up 1.02% on the week. December silver rose Friday, settling at $16.395 an ounce, up 0.5% on the week.
In the Kitco News Gold Survey, out of 36 participants, 23 responded this week. Of those, 14 see prices up, while six see prices down and three see prices sideways or unchanged. Market participants include bullion dealers, investment banks, futures traders and technical chart analysts.
Gold saw a volatile trading this week, ultimately closing the week higher and notching a third straight week of gains. A surprise interest rate cut Friday by China pumped up the yellow metal, traders said. The People’s Bank of China cut the one-year benchmark lending rate by 40 basis points to 5.6% and the one-year deposit rate by 25 basis points to 2.75%.
“At face value, policy easing in China should be gold-supportive, particularly if it helps to hold up economic growth,” said Joni Teves, analyst at UBS. “But UBS China economists do not think that today's rate cut moves the needle for 2015 GDP growth expectations. So, while today's rate cut may be gold-friendly at the margin, ultimately the effect should be more muted than what the initial reaction might suggest.”
Gold managed a rise above $1,200 even as the dollar gained on the Chinese news and as the European Central Bank started to buy asset-back securities as part of its stimulus program.
George Gero, vice president with RBC Capital Markets Global Futures, said gold attracted some buying when it rebounded over $1,200.
“There were too many negatives priced in the past two weeks,” he said about why gold bounced on Friday.
Gold will start out the week watching Monday’s options expiration for the December contract, and it could lead to some volatility, Gero said. Option strike prices that are “in the money” or are the same value as the current futures price will become futures after the expiration.
“There were many $1,125 and $1,100 strike puts and there are many $1,200 and $1,225 call options as well, so some nail-biting may ensue,” he said.
Early next week also features traders moving positions out of the December futures and into deferred months as the calendar nears the month of December, he said. Ahead of first notice day traders need to eventually exit futures positions of the spot month according to exchange rules.
Later in the week, analysts said they’ll watch to see what eurozone inflation data shows. Inflation has remained tame, which doesn’t support gold, analysts said, and eurozone inflation has been particularly soft.
In the U.S., third-quarter gross domestic product data is set for release, and analysts at Nomura expect it will come in at 3.5%, which is unchanged with the preliminary reading.
Robin Bhar, head of metals research at Société Générale, said those two data sets will likely underscore the current view of a stronger U.S. economy versus a weakening eurozone.
“I think the theme will still be U.S. growth, and the Fed (Federal Reserve) is ooh-ing an ahh-ing about being data dependent, and it (stronger data) could cause the Fed to have to raise rates down the road, which would weigh on gold,” he said.
Thursday is the Thanksgiving holiday in the U.S. and markets are closed. Trading volume could slow as the week nears Thursday, and Friday is often taken as a day off to extend the holiday. Markets are open as usual on Friday.
Bhar said in addition to Thanksgiving, there are a couple of other holidays next week, too. He said it’s possible that gold prices could try to consolidate at higher values amid the lower volume; however, he said the light trading volume could mean a greater chance for whippy action.
“It could allow Asian (traders) to bully the market down. We’ve seen some heavy selling in the Asian time zone and we know the liquidity … is thin,” he said.
Gero and Bhar both said next week’s OPEC meeting on Thursday will be a key event, too. Crude oil prices have fallen sharply as China and the eurozone use less oil because of struggling economies there. On top of that, U.S. shale production is at 30-year highs, so the globe is awash in oil. So far Saudi Arabia has been cool to the idea of cutting production to support prices, so people will be watching this meeting to see if the cartel decides to cut output.
“If there are production cuts, it could lift oil prices and support gold as it would be mildly inflationary, but if they don’t cut to shore up production that could be another negative for gold,” Bhar said.
Traders could position themselves ahead of the Nov. 30 Swiss gold referendum vote, said Ira Epstein, of the Ira Epstein division of the Linn Group. The ballot measure calls for the Swiss National Bank to not sell any more gold, have all Swiss-owned gold housed in-country and require that 20% of the SNB’s assets be in gold bullion.
Polls taken ahead of the vote show the “no” side with the edge and the gold market moved to its low for the week when the most recent poll came out Wednesday.
“The swings (in the market ahead of the vote) are and will continue to be fairly wild unless the poll results widen in favor of the ‘no’ vote,” Epstein said, who added he believes the measure will fail.
22:02
Unknown
Gold Prices Starts Week Hovering Around Initial Support At $1,200
Gold prices are starting the week holding on to recent gains, hovering around initial support at $1,200 an ounce.
Electronic trading of Comex December gold futures opened the Sunday North American evening/Monday Asian session at $1,199.90 an ounce, relatively up from Friday's pit close of $1,197.70 an ounce.
About 40 minutes after the open, gold futures reached an early session high of $1,203.80 an ounce. Since then prices have been trading in a modestly tight range; as of 9:36 p.m. EST December gold was at $1,200.40 an ounce.
Electronic trading of Comex December silver futures opened the Sunday evening/Monday morning session at $16.365 an ounce, slightly down from Friday's pit close of $16.395 an ounce. Similar to gold, the silver market has traded in a small range; as of 9:36 p.m. EST, December silver was at $16.405 an ounce.
Victor Thianpiriya, commodity strategist at ANZ, said that although gold is holding on to some of its strength the market remains positioned for lower prices in the near-term.
On a technical basis he said $1,200 will continue to act as strong initial support. The next level on the upside he is watching is the mid-October high of $1,255 an ounce.
However, Thianpiriya said that he expects the U.S. dollar will remain strong and in turn hurt the gold market.
“All the growth right now is in the U.S. and that is positive for the U.S. Dollar, negative for gold,” he said. “I don’t think the market has fully priced in the Federal Reserve’s next move.”
Chris Weston, commodity analyst at IG Markets, said that although he is generally bearish on gold, momentum appears to be supporting prices in the near-term.
However, Weston added that prices could move higher next week as traders exit their short positions ahead of Switzerland’s Gold Referendum. Polls shows that there isn’t enough support for the vote to pass, but Weston added that the risks still aren’t worth it, on the outside chance that it passes.
“Gold prices could easily rally $50 an ounce in one session if the vote passes, which I think is unlikely,” he said.
Looking at technicals, Weston said that the key level in gold will be $1,208 an ounce. He added prices need to break above that to test the next major resistance level of $1,276 an ounce.
Analysts from HSBC said in a note published Friday that gold needs a “convincing close” above $1,200 an ounce to encourage further gains in the marketplace.
20:39
Unknown
Gold’s Volatility & Other Things to Watch
Gold’s reversal from $1130 to $1200 combined with sharp rebounds in the gold miners has given precious metals bulls some hope that the bottom may be in. A few weeks ago we noted that the sector was extremely oversold and a snapback rally could begin. Gold has been the tell for the bear market and a real bull market throughout the precious metals complex may not begin until Gold’s bear has ended. In this editorial we dig deeper into some things to watch as they pertain to Gold.
First we will focus on Gold’s volatility. The chart below shows Gold and two volatility indicators: the CBOE volatility index and average true range. Peaks in daily volatility have coincided with important peaks and troughs in the Gold price. Volatility declined from summer 2013 through summer 2014 before perking up as Gold declined from $1255 to $1130. Yet both volatility indicators are not close to extremes. Volatility does not necessarily need to reach an extreme to signal a bottom. However, the two biggest volatility spikes were at the 2008 bottom and 2011 peak. A sharp decline in Gold below $1100 towards major support combined with a spike in volatility could signal a major turning point.
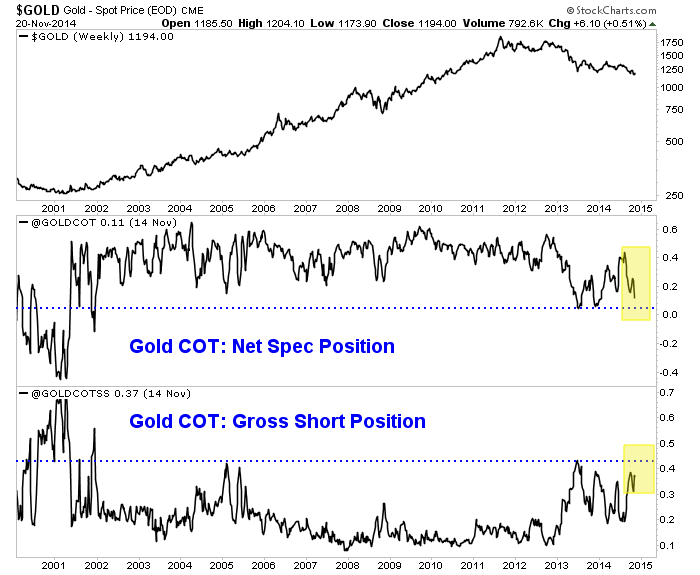
I’m also focusing on the COT as its an excellent sentiment indicator. By some metrics (objective and anecdotal) Gold’s bear market has reached extreme territory. However, the COT is presently not at an extreme. We plot (as a percentage of open interest) the net speculative position and the gross short position. If these readings can exceed the 2013 extremes then they would be at 13-year extremes. A spike in the gross short position, while negative in the short-term provides future fuel (short covering) for a very strong rebound off the bottom.
Meanwhile, let’s not forget Gold’s relative strength. We shared the importance in a recent missive. We noted Gold’s relative strength tends to perk up before Gold itself bottoms. The chart below plots Gold against a foreign currency basket (the inverse of the US$ index) and Gold against the S&P 500. Gold is holding up well against foreign currencies but is coming to an inflection point. I don’t think its going to breakout yet but I could be wrong. Meanwhile, Gold continues to be very weak against the stock market.
Gold has been the tell for the bear market and my work leads me to believe the bottom is ahead and not behind us. Last week we noted the likelihood of a test of major support near $1000/oz rather than a bottom at an arbitrary level. In addition, Gold has yet to have a volatility spike on par with the spikes at the 2008 bottom and 2011 top. Moreover, current positioning in the futures market remains below the extremes seen in 2013. Finally, Gold has more work to do on the relative strength front before it can sustain a recovery.
All this being said, it is important to keep an open mind to various possibilities. Silver and the mining stocks are totally bombed out and we should pay close attention if they retest their lows. The weeks and months ahead figure to be enticing and exciting for precious metals traders and investors. Expect quite a bit of day to day volatility as we see forced liquidation and occasional short covering. Be patient but be disciplined. As winter beckons we could be looking at a lifetime buying opportunity. I am working hard to prepare subscribers.
19:52
Unknown
Gold: Now What?
Mary Anne & Pamela AdenThe Aden Sisters
Posted Nov 22, 2014
Gold has been volatile in recent weeks. It broke down, then it bounced back up. So where does it currently stand?
Gold’s timing will help us in identifying the lows and the steps upward towards a new bull market.
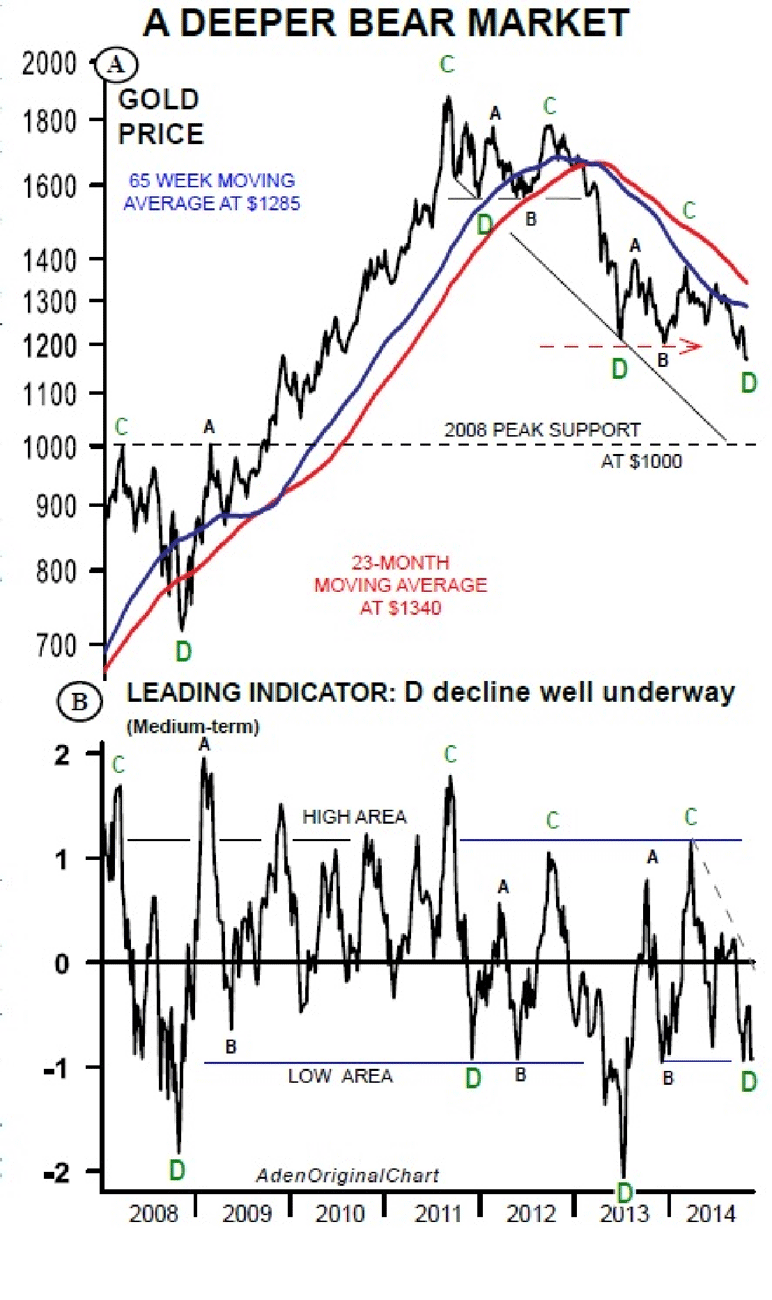
Chart 1 shows our favorite gold timing tool. As our older readers know, gold has had recurring cycles going back for years.
(Click on image to enlarge)
Currently, a D decline has been underway since last March when gold’s 2014 rise petered out. D declines tend to be the worst decline in gold’s cycle. And during bear markets, D declines usually take gold to new lows for the bear market.This is exactly what happened this month. Most impressive, the leading indicator has yet to fall into the extreme low areas that normally coincide with D lows... This means gold could still go lower before this decline is over.
On the downside, gold will remain weak below $1200, and especially below its $1180 low. And the longer this is the case, the more likely we’ll see lower lows soon.
A clear decline below $1150 means $1100 would be a shot away. This would likely take the indicator down to test the extreme D lows.
GOLD SHARES: Fell the most
Gold shares, however, took the cake. They plunged much more than gold and silver. And the gold share indexes fell to their 2008 lows. That is, they fell to the lows of the depths of the financial crisis washout.
The HUI Gold Bugs index is now starting to consolidate near these lows above 150, and as long as that’s the case, we just may see the start of constructive base-building.
Gold mining shares are weaker than gold, the most they’ve ever been since the 1960s. This weakness is not over yet, but the 5 week moving average works well in identifying the start of a turn.
So keep an eye on 170 for HUI. If it can stay above this level, gold shares will be looking better and they could then be leading gold.
Subscribe to:
Posts
(
Atom
)