Wednesday, 3 December 2014

Wednesday's Analytical Charts for Gold, Silver and Platinum and Palladium


All Quiet On The Golden Front


Gold continues to hold the $1,200 level, despite a stronger U.S. dollar and weaker oil prices overnight. The markets are awaiting the ECB meeting tomorrow for signs that Draghi announces a more formalized QE program. If the ECB stays the course, some squaring in the euro/dollar trade may prove beneficial for gold. The ETFs are also posting net inflows into the yellow metal, as funds may be adding some insurance against the lofty equity market. The next few weeks will see increased volatility as tax loss selling  enters the equation. This would be the time to speak to your accountants on the rules for this process, if your intention is to sell for a loss but maintain the underlying protection.
By Peter Hug 
The Oil-Drenched Black Swan, Part 1   


Given the presumed 17% expansion of the global economy since 2009, the tiny increases in production could not possibly flood the world in oil unless demand has cratered.

The term Black Swan shows up in all sorts of discussions, but what does it actually mean? Though the term has roots stretching back to the 16th century, today it refers to author Nassim Taleb's meaning as defined in his books, Fooled by Randomness: The Hidden Role of Chance in Life and in the Markets and The Black Swan: The Impact of the Highly Improbable:


"First, it is an outlier, as it lies outside the realm of regular expectations, because nothing in the past can convincingly point to its possibility. Second, it carries an extreme 'impact'. Third, in spite of its outlier status, human nature makes us concoct explanations for its occurrence after the fact, making it explainable and predictable."
Simply put, black swans areundirected and unpredicted. The Wikipedia entry lists three criteria based on Taleb's work:
1. The event is a surprise (to the observer).
2. The event has a major effect.
3. After the first recorded instance of the event, it is rationalized by hindsight, as if it could have been expected; that is, the relevant data were available but unaccounted for in risk mitigation programs.


It is my contention that the recent free-fall in the price of oil qualifies as a financial Black Swan. Let's go through the criteria:
1. How many analysts/pundits predicted the 37% decline in the price of oil, from $105/barrel in July to $66/barrel at the end of November? Perhaps somebody predicted a 37% drop in oil in the span of five months, but if so, I haven't run across their prediction.
For context, here is a chart of crude oil from 2010 to the present. Note that price has crashed through the support that held through the many crises of the past four years. The conclusion that this reflects a global decline in demand that characterizes recessions is undeniable.

I think we can fairly conclude that this free-fall in the price of oil qualifies as an outlieroutside the realm of regular expectations, unpredicted and unpredictable.
Why was it unpredictable? In the past, oil spikes tipped the global economy into recession. This is visible in this chart of oil since 2002; the 100+% spike in oil from $70+/barrel to $140+/barrel in a matter of months helped push the global economy into recession.
The mechanism is common-sense: every additional dollar that must be spent on energy is taken away from spending on other goods and services. As consumption tanks, over-extended borrowers and lenders implode, "risk-on" borrowing and speculation dry up and the economy slides into recession.

But the current global recession did not result from an oil spike. Indeed, oil prices have been trading in a narrow band for several years, as we can see in this chart from the Energy Information Agency (EIA) of the U.S. government.

Given the official denial that the global economy is recessionary, it is not surprising that the free-fall in oil surprised the official class of analysts and pundits. Since declaring the global economy is in recession is sacrilege, it was impossible for conventional analysts/pundits to foresee a 37% drop in oil in a few months.
As for the drop in oil having a major impact: we have barely begun to feel the full consequences. But even the initial impact--the domino-like collapse of the commodity complex--qualifies.
I will address the financial impacts tomorrow, but rest assured these may well dwarf the collapse of the commodity complex.
As for concocting explanations and rationalizations after the fact, consider the shaky factual foundations of the current raft of rationalizations. The primary explanation for the free-fall in oil is rising production has created a temporary oversupply of oil: the world is awash in crude oil because producers have jacked up production so much.
Even the most cursory review of the data finds little support for this rationalization. According to the EIA, the average global crude oil production (including OPEC and all non-OPEC) per year is as follows:
2008: 74.0 million barrels per day (MBD)
2009: 72.7 MBD
2010: 74.4 MBD
2011: 74.5 MBD
2012: 75.9 MBD
2013: 76.0 MBD
2014: 76.9 MBD
The EIA estimates the global economy expanded by an average of 2.7% every year in this time frame. Thus we can estimate in a back-of-the-envelope fashion that oil consumption and production might rise in parallel with the global economy.
In the six years from 2009 to 2014, oil production rose 3.9%, from 74 MBD to 76.9 MBD.Meanwhile, cumulative global growth at 2.7% annually added 17.3% to the global economy in the same six-year period. What is remarkable is not the extremely modest expansion of oil production but how this modest growth apparently enabled a much larger expansion of the global economy. ( Other sources set the growth of global GDP in excess of 20% over this time frame.)
Global petroleum and other liquids reflects a similar modest expansion: from 89.1 MBD in 2012 to 91.4 MBD in 2014.
Given the presumed 17% to 20+% expansion of the global economy since 2009, the small increases in production could not possibly flood the world in oil unless demand has cratered. The "we're pumping so much oil" rationalizations for the 37% free-fall in oil don't hold up.
That leaves a sharp drop in demand and the rats fleeing the sinking ship exit from "risk-on" trades as the only explanations left. We will discuss these later in the week.
Those who doubt the eventual impact of this free-fall drop in oil prices might want to review The Smith Uncertainty Principle (yes, it's my work):

Every sustained action has more than one consequence. Some consequences will appear positive for a time before revealing their destructive nature. Some will be foreseeable, some will not. Some will be controllable, some will not. Those that are unforeseen and uncontrollable will trigger waves of other unforeseen and uncontrollable consequences."
Analyzing Monday’s Massive Swings In Gold & Silver

Is Monday's volatility a signal or just noise?

Though just two days in, this week is already shaping up to be one of the most volatile for gold and silver in a while. On Monday, prices briefly plummeted; gold hit a low of $1,143, while silver touched a five-year low at $14.29. Then, just as fast as it fell, the duo zoomed back up, spiking as high as $1,222 and $16.81 for gold and silver, respectively.
Gold 

As is often the case during volatile moments in the market, there were numerous explanations for the day's furious trading action. One such explanation centered around oil; gold and silver simply followed oil down--and then back up--as crude prices gyrated after hitting the lowest levels since 2009 early on Monday.
Another explanation pointed to the failure of a referendum on gold in Switzerland and a credit downgrade in Japan as sparking the volatility. Swiss voters rejected a proposal that would have required the central bank to purchase more gold, sending prices initially lower. Later in the day, Moody's cut Japan's sovereign credit rating from AA3 to A1, helping to send prices back up.
A Lot Of ‘Noise’
Then there's always the convenient "short covering" explanation that commentators like to throw around to explain any sudden, unexpected movements in the markets.
All that said, what prompted Monday's price swings wasn’t that relevant from a bigger-picture perspective. The fact is, gold has been holding near the $1,200 level for some time now, at around the same price that the yellow metal began the year.

None of the recent events--oil's decline, the Swiss vote, Moody's Japan downgrade or any other factor--has been able to break gold out of its comfort zone and ignite a consistent trend (either up or down) in prices. That makes these events essentially "noise," and gold should be considered trendless until a bigger catalyst emerges.

What Does the End of QE3 Really Mean?

Arkadiusz Sieron

So it finally happened. The Federal Reserve ended its Quantitative Easing program on October 29, 2014 due to concerns that keeping QE for so long could fuel excessive risk-taking by investors. The U.S. dollar continued to conquer new heights, while gold did not welcome this central bank action. Its price fell in November to $1,142, a four-year low. This is not surprising given the fact that as we wrote (in the last Market Overview), the condition of the U.S. dollar is one of the most important drivers of gold prices.
However, the future (in the medium term) of the yellow metal’s price in the post-QE world is unclear. So much is unknown. When will Fed hike the interest rates? Is the U.S. central bank going to get rid of the enormous level of assets it bought? How and when does it plan to do so? How will the financial market perform without stimulus? Is the end of QE really a sign of a strong U.S. recovery? Some analysts agree, forecasting that gold will fall towards the $800-$900 level, while other economists fear that without Fed’s bond-buying program, a market crash may be on its way, leading to renewed investors’ interest in gold. 
As a result, markets are confused right now. In this edition of Market Overview we try to clarify concerns about the impact of the end of QE3 on the U.S. economy and gold market. But first, let’s analyze what the recent halt of QE really means.
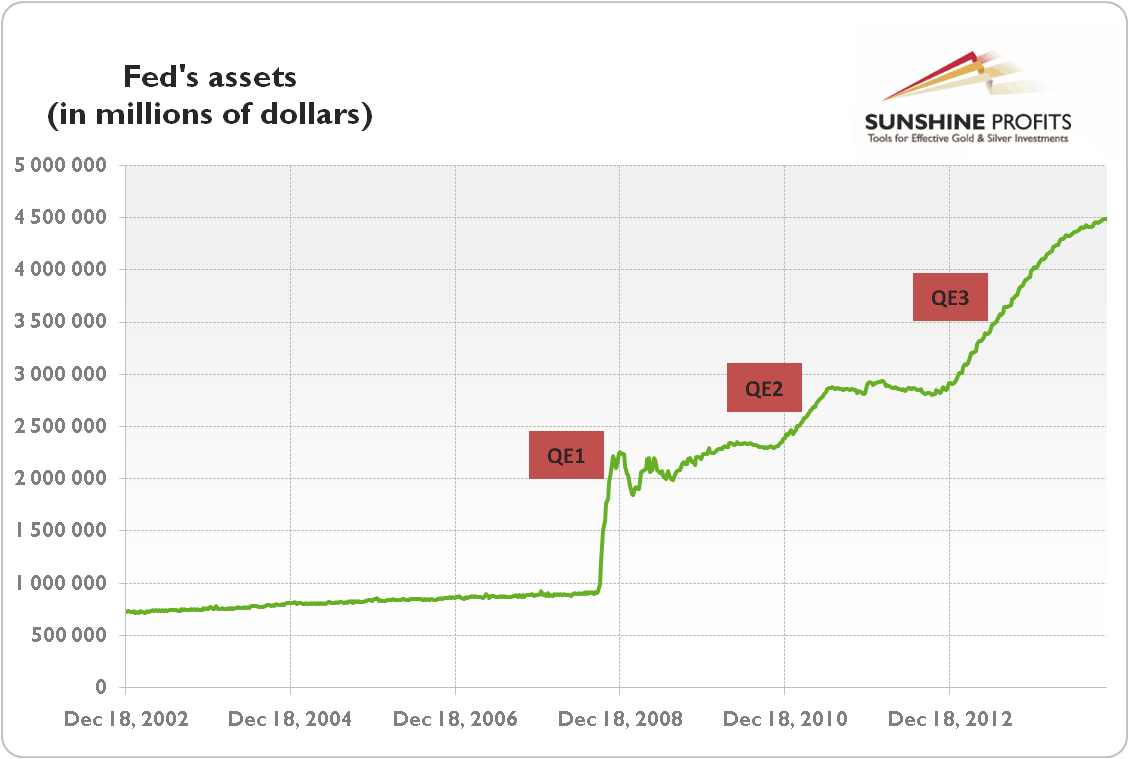
The quantitative easing was an unconventional monetary policy of buying financial assets from commercial banks. It increased the monetary base, Fed’s balance sheet and prices of purchased assets, decreasing their yields. The third, and for now the last, round of quantitative easing was announced on September 13, 2012 without stating the end date. Initially, the program involved purchases of agency mortgage-backed securities at a pace of $40 billion per month, but was extended to purchases of Treasuries involving $45 billion per month. In this largest asset-buying program, the Fed purchased assets worth around $1.6 trillion, expanding its balance sheet to about $4.5 trillion.
Graph 1: Fed’s assets (in millions of dollars) from 2002 to 2014
Theoretically, the halt of QE3 means the end of the multi-year asset purchases. However, not completely, because the “Committee is maintaining its existing policy of reinvesting principal payments from its holdings of agency debt and agency mortgage-backed securities in agency mortgage-backed securities and of rolling over maturing Treasury securities at auction,” as seen in the statement released by the Fed on October 29, 2014. It implies that although the Fed discontinued expanding its balance sheet, it will not allow it to shrink, at least for some time. And we are not talking about small amounts. According to Treasury Borrowing Advisory Committee estimates, if the Fed decides not to roll Treasuries (large amounts of them start maturing in 2016) over into new debt, the Treasury would be forced to borrow an extra $675 billion from the public over a three-year period. Therefore, the end of QE3 does not imply the end of quantitative easing. To use a metaphor, ending QE is not putting on the brakes; it is just easing off the accelerator.
However, even the complete reversal of QE3 would not mean the abandonment of the quantitative easing concept. The asset-buying program has become an established part of the Fed’s policy that could be implemented again in times of crises. Fed Chairwoman Janet Yellen has already said explicitly that she would not rule out more assets buying if needed. It is not coincidence that we have witnessed three rounds of the quantitative easing. We hope you remember that after the end of QE1 in March, 2010, there was a substantial correction in stocks (just under 20%), leading the U.S. central bank to start QE2. Then, after the halt of QE2 in June, 2012, there was another important stock market decline (about 20%), and that was the reason why the Fed launched the third round of QE. Given the fragile nature of the global economy, if asset prices fall or economic growth falters, we could witness QE4, especially since the Fed’s actions are data driven.
We focus on the U.S. central bank’s policy and its implications for the gold market in our monthly Market Overview reports and we invite you to check them out. We also provide Gold & Silver Trading Alerts for traders interested more in the short-term prospects. If you’re not ready to subscribe now, we still encourage you to join our gold newsletter. It’s free and you can unsubscribe in just a few clicks.

SILVER Elliott Wave Technical Analysis – 1st December, 2014

Lara Iriarte
Posted Dec 3, 2014

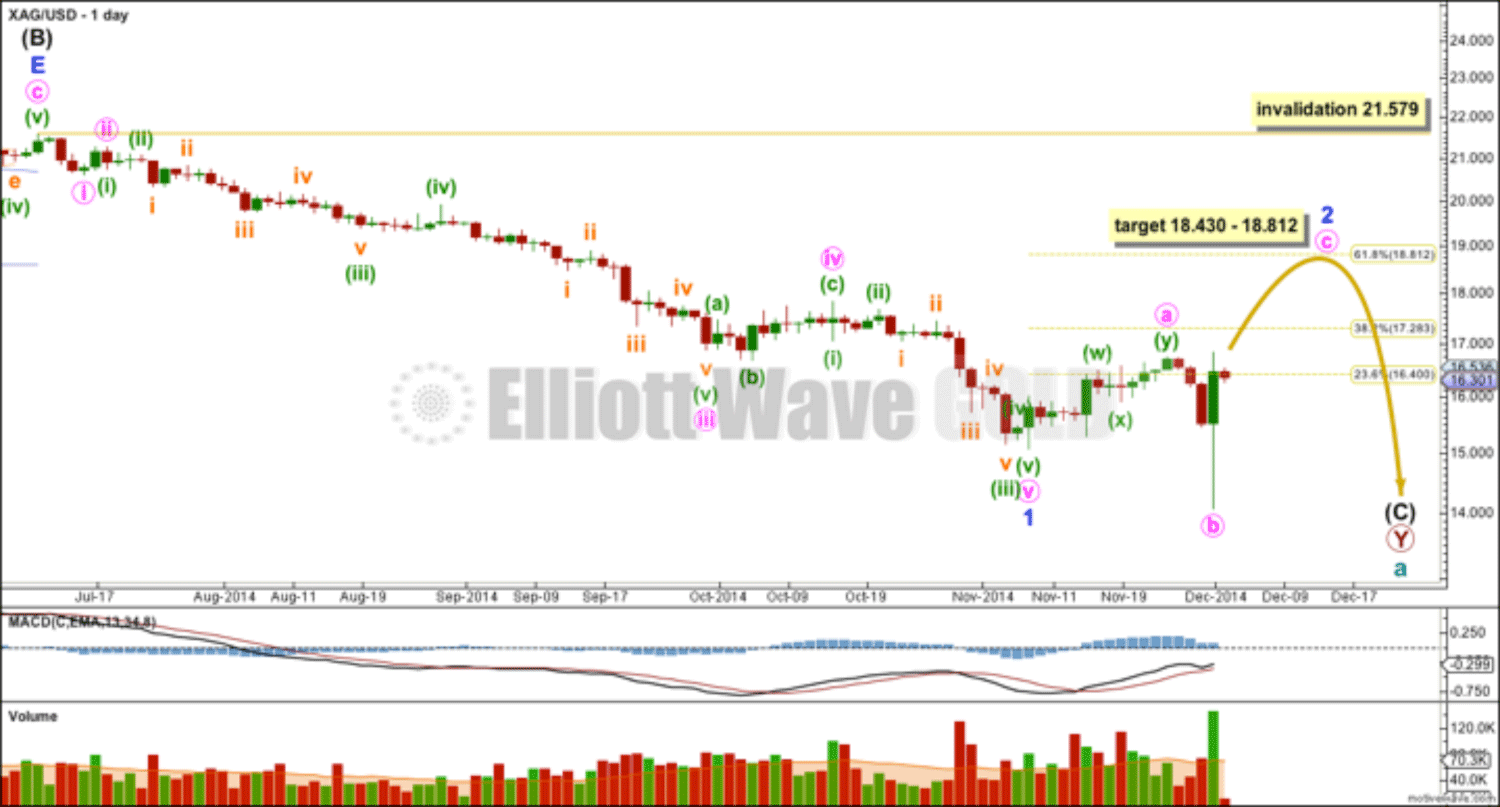
Downwards movement invalidated both daily Elliott wave counts, published two days ago. This Elliott wave count is updated and still expects upwards movement.
(Click on image to enlarge)
At 18.430 minute wave iii would reach 2.618 the length of minute wave i. This is close to the 0.618 Fibonacci ratio of minor wave 1 at 18.812. The target may be about two weeks away.

Tuesday, 2 December 2014

P.M. Kitco Roundup: Gold Sees Corrective Pullback Amid Bearish Outside Markets


Gold prices ended the U.S. day session solidly lower Tuesday and gave back about half of Monday’s strong gains. Lower crude oil prices and a sharply higher U.S. dollar index were bearish “outside market” forces working against the precious metals markets on this day. February Comex gold was last down $20.00 at $1,198.10 an ounce. Spot gold was last down $13.70 at $1,199.50. March Comex silver last traded down $0.257 at $16.43 an ounce.
The eyes of the market place remain on crude oil prices. After posting a strong rebound Monday, crude was under selling pressure again Tuesday. Nymex crude on Monday hit a five-year low of $63.72 a barrel. Volatility in crude oil and gold has been extremely high in recent sessions, much to the consternation of both bulls and bears. It is days like the past two sessions that brutalize traders with wild price swings that force them to liquidate their positions—only to see prices then turn around and move in the favor of their originally placed trades.
The U.S. dollar index was sharply higher Tuesday and hit a fresh contract and four-year high.
In other overnight news, the European Union producer price index was down 0.4% in October and down 1.3% year-on-year. This adds to a string of EU economic data that suggests deflationary price pressures are at work in the world’s third-largest economy. The report falls into the camp of those market watchers wanting the European Central Bank to further stimulate its monetary policy sooner rather than later. The ECB holds its regular monthly meeting on Thursday.
The Russian Economy Ministry said Tuesday the Russian economy will fall into recession in 2015, with inflation being problematic due to the slumping value of the ruble against the other major world currencies.
The London P.M. gold fix was $1,195.00 versus the previous London A.M. fixing of $1,197.00.
Technically, February gold futures prices closed nearer the session low today. Bears have the overall near-term technical advantage. Still, Monday’s price action hints of a near-term market low being in place. But the bulls need to show fresh power soon to better suggest such. The gold bulls’ next upside near-term price breakout objective is to produce a close above solid technical resistance at Monday’s high of $1,221.00. Bears' next near-term downside price breakout objective is closing prices below solid technical support at last week’s low of $1,163.90. First resistance is seen at $1,200.00 and then at today’s high of $1,212.60. First support is seen at today’s low of $1,191.40 and then at $1,184.80. Wyckoff’s Market Rating: 2.5
March silver futures prices closed nearer the session high and saw a corrective pullback from Monday’s big gains. Price action Monday scored a big and bullish “key reversal” up on the daily bar chart, which suggests the bears have become exhausted and a market bottom is in place. The silver bears still have the overall near-term technical advantage. Silver bulls’ next upside price breakout objective is closing prices above solid technical resistance at $17.00 an ounce. The next downside price breakout objective for the bears is closing prices below solid support at last week’s low of $15.41. First resistance is seen at Monday’s high of $16.81 and then at $17.00. Next support is seen at today’s low of $16.07 and then at $15.93. Wyckoff's Market Rating: 2.5.
March N.Y. copper closed down 85 points at 288.95 cents today. Prices closed nearer the session high. Prices Monday hit a contract and multi-year low. Monday’s price action suggests the bears became exhausted at the lower price levels. Good follow-through buying early this week would suggest a market bottom is in place. But right now the bears have the solid near-term technical advantage. Copper bulls' next upside breakout objective is pushing and closing prices above solid technical resistance at 300.00 cents. The next downside price breakout objective for the bears is closing prices below solid technical support at Monday’s contract low of 277.75 cents. First resistance is seen at Monday’s high of 290.55 cents and then at 292.50 cents. First support is seen at today’s low of 2.8440 cents and then at 282.50 cents. Wyckoff's Market Rating: 1.5.

Analysts See Short-Term Boost For Gold, Euro Thursday With No New ECB QE

By Neils Christensen 

Gold and the euro could see short-term rallies Thursday as the European Central Bank holds off introducing new quantitative easing measures following its monetary policy meeting, some analysts say.
The gold market has been extremely volatile, with major prices swings seen in the last few days and analysts are expecting the ECB meeting will add to the mix as expectations have been growing that central bank president Mario Draghi will announce an expanded asset-backed purchase program and buy government bonds.
As recently as Nov. 21, Draghi said the ECB is willing to increase its efforts to stimulate the Eurozone’s struggling economy.
However, some analysts said it is still too early for the central bank to expand its purchase program and the lack of new information could help drive the euro higher, on initial short covering, and in turn boost gold prices.
Bill Baruch, chief market strategist at iiTrader, said that the weaker-euro-stronger-U.S.-dollar trade appears to be losing some momentum as the U.S. Dollar Index, which is heavily weighted against the euro, runs into strong resistance around the 89 level.
He added that Draghi likes to talk down the euro during his monthly press conference, following the monetary policy meeting, but that could prove difficult on Thursday if he doesn’t announce new concrete initiatives.
If Draghi doesn’t announce that the ECB will start to purchase government bonds, Baruch said that he would expect traders to cover some of their short positions in the euro, which means buying the single currency and selling U.S. dollars.
However, even if gold does get a boost on Thursday, it might not have enough power to break through initial resistance at around the $1,221-an-ounce level, he said.
“After the big swings in the last few days, I think we will find ourselves in a consolidation pattern this month ahead of nonfarm payrolls and the Federal Reserve (Open Market Committee) meeting,” he said. “There is a risk that the euro moves higher but gains will be limited.”
Analysts from Capital Economics said that although central bank officials have openly discussed the possibilities of buying government bonds, they are not expecting a new purchase announcement until the 2015.
Peter Buchanan, senior economist at CIBC agreed, saying that he is expecting the ECB to hold off on announcing new initiatives, at least until they determine the impact of lower oil prices on the economy. Although weaker crude prices are deflationary they are also a major tax break for consumers, he said.
“Central banks are still grappling with lower oil prices and I don’t think they will make any decisions until they know the full impact on the economy,” he said.
Buchanan added another factor against the ECB expanding its asset-purchase program is continued resistance from other central banks, most notably the German central bank.
Although a euro rally on Thursday could provide some short-term momentum for gold prices, Buchanan also explained that overall it is bearish for the yellow metal as the ECB will not loosen its monetary policy, pushing down inflation expectations, a significant driver of the gold market.
Expectations for further QE initiatives are a close call as European economic growth remains weak and inflation expectations hover near historical lows; for some market participants, there is a feeling of urgency for the central bank to act aggressively.
Currency analysts from BNP Paribas said that they are expecting the ECB to announce that it will buy sovereign debt at Thursday’s meeting, which would be negative for the euro and negative for gold prices. They said the euro looks “under-positioned” ahead of the monetary policy meeting.
“We think comments from President Draghi and Vice President Constancio are likely to prove more instructive—both made supportive remarks on the merits of sovereign QE and seem unlikely to have delivered this message without being confident in their ability to deliver new announcements this week,” they said.

About Face


Gold pulled back today in the face of stronger equities, a solid rise in the dollar and new weakness in oil. It is a good time to remind ourselves, though, that gold is up 2-1/4% in the last month. We’re going to have to ascertain where our trends lie for the remainder of the year and into the New Year.
Stocks were up on the power of new car sales. U.S. automobile sales rose 4.6 percent in November to 1.3 million, Auto data reported, with the auto sales rate coming to 17.2 million last month, the strongest pace for the month since 2003. The strong sales reflect, despite some shakiness in consumer confidence that the American economy is hitting on all cylinders, the recovery remaining broad-based and modestly deep.
This notion was reinforced by construction spending, which was up 1.1% on the month. The key to the robustness of that number is that spending seems to have shifted away from home building to larger projects like office buildings, factories, hospitals and schools.
It’s quite natural that the dollar would find muscle in these numbers. The dollar is at a 4-1/2 year high. Certainly that is helping to pressure all commodities, but gold and oil, in particular are suffering price volatility.
While we should be happy as consumers that the prices of oil and gasoline are falling, we need to remain aware that the oil industry accounts for 30% of all capital construction and equipment in the U.S. Will that be transferred elsewhere? A good question.
Some are saying that the price dip we saw today in gold is a “corrective pullback.” We feel gold is returning to its natural course in a booming economy. Whether Europe, Asia, and the second-world economies like Brazil, Russia, India and South Africa make up the slack by buying remains to be seen.  
Wishing you as always, good trading,
Gary Wagner