Thursday, 4 December 2014

Gold Market Update


On gold’s 6-month chart we can see how it approached its November lows in the early trade after the Swiss vote, but rallied strongly on big volume to close above its November highs, above the recently failed key support that is now resistance and above its 50-day moving average, which was quite an accomplishment, leaving behind a large “Bullish Engulfing Pattern” on its chart. This points to a probable strong advance dead ahead, so today’s reaction should be used to clear out any short positions, and also to go long aggressively with stops below the November low. This action by gold, and by silver, suggests that the current bull Flag in the dollar, which is getting a bit “long in the tooth”, may be about to abort.
Yesterday was an extraordinary day in the Precious Metals markets, with a good chance that it signals the reversal from the brutal 3-year plus bearmarket that so many have waited so long to see. The day started with gold and silver plunging on the news that the Swiss voted against backing their currency with gold, but later in the day they rallied strongly on heavy turnover to close with giant reversal candlesticks on their charts. Regardless of the reasons for this bizarre behavior, technically this action looks very positive, and this is written with the awareness that gold has reacted back this morning on dollar strength.

On the 18-month chart we can see the unusual action in gold since its broke down below the key support level at last year’s lows late in October. After such a breakdown, going on price alone, we would naturally expect to see follow through to the downside, but there was very little reaction before it turned around and took on the support level that had become resistance. It backed off again last Friday and into yesterday morning before the dramatic reversal later in the day which took it back above the resistance. However, around the time gold dropped to new lows, COTs and sentiment indicators were already bullish, as we noted at the time, which made the market very difficult to call, but yesterday’s action was the most bullish we have seen in a long time, so there is a good chance that the bottom is in.

On the long-term 15-year chart we can see that the combination of the failure of support at last year’s lows, and the failure of the long-term uptrend, clearly opened up the risk of a drop back to the strong support in the $1000 zone, although matters were complicated by the already bullish COTs and sentiment, as mentioned above. Now, with yesterday’s bullish price and volume action, the smoke is beginning to clear, and we can see the implications of the bullish COTs and sentiment starting to translate into price and volume action. The result is that it looks like the bottom is in, and that gold won’t drop back as far as $1000 after all. Instead, it could take off higher from here, and given the heavy bearish sentiment that has prevailed of late, it could be a scorcher of a rally with the afterburners full on.

Now we will look at the dollar. Until now we have interpreted the tight sideways pattern in the dollar that has formed in recent weeks as a very bullish “running Flag” so called because it is upwardly skewed which makes it more bullish, which is shown on the 6-month chart below. However, we were also aware that COTs and sentiment for the dollar are already at bearish extremes, so our view was that the dollar would have one last upleg before calling it a day. The implications of the bullish action in gold yesterday are that this won’t happen – instead the dollar Flag will abort and it will break lower, or that if it does advance it won’t be by far. This is certainly a possibility as this Flag is getting “long in the tooth” and the uptrend in the dollar could thus be morphing into a bearish Rising Wedge.

The latest US dollar hedgers chart, which is a form of COT chart, shows readings that well into bearish territory, although they have eased somewhat in recent weeks as the dollar has crept higher.
Click on chart to popup a larger clear version.
Chart courtesy of www.sentimentrader.com

Optimism towards the dollar could scarcely be greater as the following chart for the US dollar optix, or optimism index, makes clear. Readings are in “nosebleed” territory. This may however only call for a significant reaction, not necessarily a bearmarket. It is worth noting that the dollar index is close to resistance at its 2009 and 2010 peaks.
Click on chart to popup a larger clear version.
Chart courtesy of www.sentimentrader.com

What about Precious Metals stocks? At first sight their charts don’t exactly look great, even though they have been outperforming gold in recent weeks, which is a positive sign in itself. On the 5-year chart for the HUI index, we can see its horrible long downtrend from 2011 – 2012 and how it still appears to be on the defensive, with moving averages in bearish alignment and zones of resistance overhead. However, with gold and silver suddenly looking a lot better, there should be some evidence of a potential trend change visible, and there is. Assuming the recent low holds, there is a marked convergence of the downtrend, which makes it a bullish Falling Wedge, and clearly it will be an important positive development when this index breaks out first above the nearby resistance shown and then out from the downtrend a little further above.

While the chart for the HUI index, which does not show volume, is not particularly encouraging, the same is not true of the chart for the Market Vectors Junior Gold Miners, code GDXJ. The 5-year chart for GDXJ shows that volume has built up steadily over the past year to arrive at tremendous climactic levels. The is definitely a sign that we are at a bottom, or close to it, since only fools sell at such low levels with such huge losses, and somebody is taking the other side of the trade, that somebody being Smart Money. The immense volume makes it all the more bullish, as it is shows rapid rotation of stock from weak to strong hands. We picked up on this earlier this year, and thought that the bottom might be in, but it has got even more extreme with the recent new lows.

Supporting the contention that the sector is bottoming is the Gold Miners Bullish Percent Index, which actually hit zero some weeks back at the recent low after the breakdown, but has now clawed its way back up to the still dismal reading of 6.67% bullish. There is obviously plenty of room for improvement here – and plenty of scope for a sector rally.

Turning now to the latest COTs we see that, while they are not as bullish as they could be, the readings are still on the bullish side, and we should bear in mind that last week’s uptick in Commercial short and Large Spec long positions preceded the sharp drop on Friday and into Monday morning, so it will be interesting to see how the COTs look after yesterday’s sudden recovery when they are released on Friday.
Click on chart to popup a larger clear version.

The Gold Hedgers chart shown below, which goes all the way back to 2008 and is another form of COT chart, makes clear that historically, readings are quite strongly bullish now.
Click on chart to popup a larger clear version.
Chart courtesy of www.sentimentrader.com

The latest Gold Optimism chart, or Optix, is strongly bullish as it shows that extreme pessimism still prevails towards gold, which is of course exactly what you want to see at or close to a market bottom…
Click on chart to popup a larger clear version.
Chart courtesy of www.sentimentrader.com

The Rydex Traders continue to maintain their fine and long-standing tradition of being a contrary indicator. Their holdings in the Precious Metals sector are near record lows, which has got to be bullish.
Click on chart to popup a larger clear version.
Chart courtesy of www.sentimentrader.com

According to the long-term XAU index over Gold chart, the sector is even more attractive than it was back in 2000 before the start of the bullmarket, because stocks have become so undervalued relative to gold – much more so than at the depths of the 2008 market crash and more still than in 2000. The rationale behind this is that when investors are fearful towards the sector, they favor bullion over stocks, as they know that bullion will always have value, whereas stocks can go to zero. What this chart shows is that right now they are more fearful towards the sector than they have ever been, and on a contrarian basis that is very bullish.

End of update. 

Jordan Roy-Byrne Believes 2015 Will See the Renewal of Gold's Secular Bull Market

Source: Kevin Michael Grace of The Gold Report  (12/1/14)
Past performance does not guarantee future performance, as they say, but Jordan Roy-Byrne, CMT, editor and publisher of The Daily Gold Premium, is persuaded that the bottom in gold is no more than a couple of months away. And after that, look out. In this interview with The Gold Report, Roy-Byrne says that his study of gold's history explains why gold could retest $1,900 per ounce by the end of 2016 before going parabolic.

Bull market

The Gold Report:
 
After falling to $1,137 per ounce ($1,137/oz), gold has rallied to $1,200/oz. Has the fabled bottom finally been reached, or will we see one final selloff?
Jordan Roy-Byrne: I do not think we have seen the bottom, but I think we are very close. It should happen within the next couple of months.
TGR: Why do you think we're so close?
JRB: Typically, markets don't bottom at random numbers. Gold has really strong support at $1,080/oz, which is the 50% retracement of the entire bull market, and at $1,000/oz, which is the key psychological level and also was a key support level in 2008–2010, so gold is more likely to test those levels than bottom at $1,137/oz.
Two more reasons to believe we haven't hit bottom are volatility and the Commitment of Traders' (COT) report. The two biggest volatility spikes in the last six years were at the 2008 bottom and then at the 2011 top. In the last month or so, volatility has picked up after being absent for most of 2014. Gold's trend is down, so increasing volatility suggests a sharp selloff that could take gold below $1,100/oz. A spike in volatility combined with major support at $1,000/oz is one recipe for a major reversal.
"Balmoral Resources Corp. has a great gold deposit, Martiniere, in a great jurisdiction, Quebec."
The COT report, which tracks futures traders, suggests that we have not hit an extreme, but again it's very close. A decline below $1,100/oz or $1,080/oz would likely result in many traders panicking out of the market and at the same time putting on more short positions. Given the current construction of the COT, a decline below $1,100/oz in gold would result in the net speculative position and gross short positions reaching 13-year extremes.
TGR: An alternative explanation for the fall in the gold price is aggressive shorting by institutions such as Goldman Sachs, perhaps aided and abetted by central banks. What do you think of that?
JRB: I don't think anything of it. Yes, short positions have increased, but this is how futures markets work. It's just sour grapes.
TGR: Talk about your bear analog for gold and what it tells us.
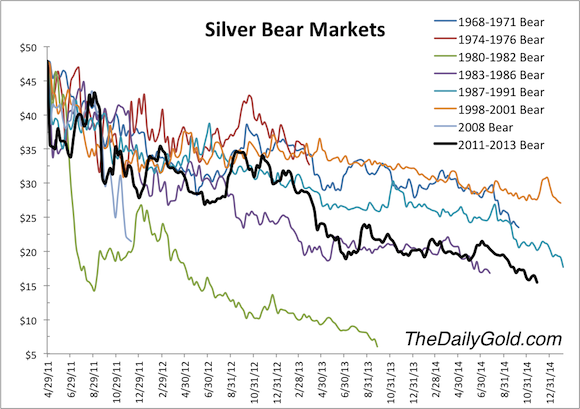
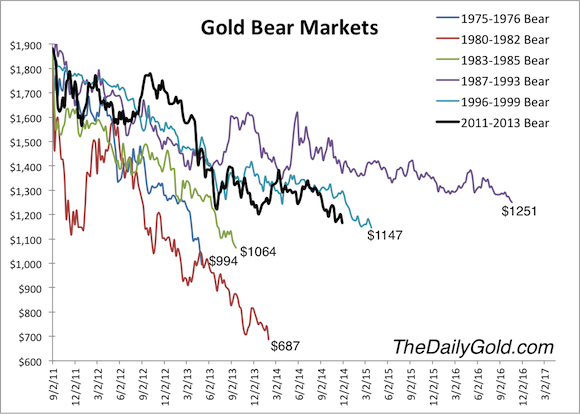
JRB: I'll talk about that but also about my analogs for silver and mining stocks. These analogs examine the historic bear markets and plot them on graphs in order to compare them. We must remember that bear markets are a function of price and time. And those with the sharpest declines last the shortest amount of time. The gold and silver crashes in the 1980s lasted less than two years. They were spectacular declines with most of the damage done quickly. But bear markets that last for years are not particularly severe in terms of price.
TGR: What do your analogs tell us about silver and mining stock bear markets?
Silver bear
JRB: Most bear markets in mining stocks average about a 65% decline. What we've seen in the current bear market is well in line with history. Silver bear market declines are typically 50–70%.
TGR: So the ongoing bear markets in gold, silver and mining stocks are historically typical?
Gold bears
JRB: The current bear markets have lasted a little over 3 years for gold and over 3.5 years for silver and mining stocks. They've been fairly severe in terms of time and price but not extreme. Keep in mind that gold went from $250/oz to almost $2,000/oz and silver from less than $4/oz to $50/oz. Those were spectacular moves.
That said, the entire bear market is more severe than what one would have expected. The reason is that we had a very strong advance in 2001–2011, with only a mini-bear market lasting six months in 2008.
TGR: What about the possibility that the current bear markets will break through historic precedents?
JRB: It's always possible. It remains my belief, however, that gold could fall another $200/oz to tick below $1,000/oz and fool people that we are still in the thick of the bear market, when we have actually come to the end. Now, if we don't have a bottom by the middle of next year, and gold is lagging under $1,000/oz, your question will be more pressing.
TGR: You also have a gold recovery analog. What does this suggest with regard to how high gold will rise with the next bull market?
Gold recovery
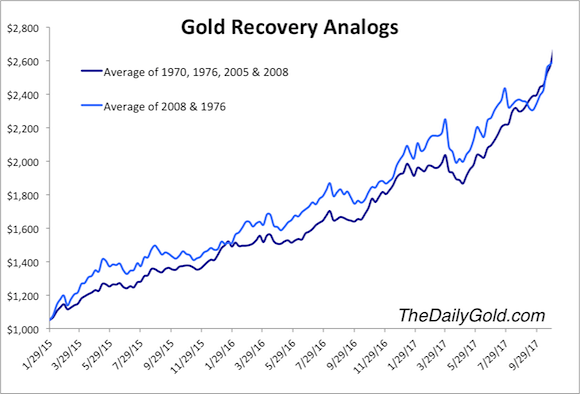
JRB: This analog examines the strongest historic cyclical moves in gold and applies them forward. My chart begins with a $1,050/oz bottom at the end of January 2015. I've merged the recoveries of 1970, 1976, 2005 and 2008 into one average and the two strongest recoveries, 1976 and 2008, into another.
These data suggest that gold should hit $1,500/oz within 12 months from the bottom. If gold does bottom in the next four months, the analog presents a very strong case that gold will retest $1,900/oz by the end of 2016.
TGR: The analog also suggests a high above $2,600/oz by September 2017. That would be an all-time, inflation-adjusted high, correct?
JRB: Correct. If gold tops $1,900/oz again, one would expect greater moves and increased volatility after that. The recovery analogs suggest that gold could start to go parabolic around $3,000/oz. How high would it go? I think $5,000–10,000/oz by maybe 2019 or 2020.
TGR: Hundreds of precious metals equities have reached 52-week lows since October. Given your forecast about the near-term bottom, is today a good day for investors to buy these stocks?
JRB: I would say no because should gold fall below $1,100/oz, there will be a final cleanout, and only then will that space be fully derisked. Over the last 18 months or so, I have been fooled several times in believing that gold stocks had been so oversold they couldn't go any lower. While they rebounded strongly for several months, they ultimately went lower.
Gold has always been the real driver of this bear market in precious metals equities, so I don't want to buy the equities until we see the final move down in gold. The bear market is mostly over. The risk/reward ratio is generally excellent now, but I think we could have a little bit more pain. And, of course, investors must choose companies carefully because these precious metals equities are all over the map.
TGR: After we've bottomed out, and market interest returns, what should investors look for in gold producers?
JRB: Number one is production growth potential and the financial position to ensure that growth. Look at companies with mines producing close to or above 100,000 oz (100 Koz) per year and mines that are early in their lives. Also, consider companies that are barely profitable right now. At $1,500/oz gold, barely profitable becomes strongly profitable. That change in margin is huge for the stock price. These are the factors that could drive the best share performance. Investors should also look for companies in the best jurisdictions because they're the best takeover targets.
TGR: What should investors be looking for in exploration and development companies?
JRB: Experienced management teams that have built mines before or sold them before or have track records of success in discovery and exploration. Their companies should have several-million-ounce deposits in good jurisdictions, deposits than can support mines at 100 Koz per year or more. Companies with smaller deposits should be avoided because such deposits will require these companies to build the mines themselves, which is really tough.
TGR: Which jurisdictions are best?
JRB: Canada, Nevada, Mexico and West Africa. This is where the majors are. And majors with operations in Nevada or Mexico, for example, will want to make acquisitions there. They don't want to build big new camps somewhere else.
TGR: How low should the all-in gold production costs of these development companies be?
JRB: Companies with deposits that require a gold price of $1,500/oz to be profitable are just too high risk. Should gold fall to $1,000/oz, these companies can fall to $0.01 a share or trade at their cash value.
Their deposits should make good money at $1,200–1,300/oz and have internal rates of return (IRRs) of at least 20% after tax. Deposits like these have the best risk/reward ratio and good leverage. And should gold rise to $1,400–1,500/oz in the next year, these companies can make really, really good money. Best of all are companies with advanced projects that have multimillion-ounce deposits that are low cost and fully financed.
TGR: Can you give an example of one such company?
JRB: Obviously, there are very few such companies out there, but one example is Guyana Goldfields Inc. (GUY:TSX) and its Aurora gold project. Aurora will produce 194 Koz per year for 17 years. Its initial capital expenditure is only $249 million ($249M). It has an after-tax IRR of 31% and an after-tax net present value of $735M. It has solid growth potential as well. Aurora's Proven and Probable resource is 3.48 million ounce (3.48 Moz) gold, while its Measured and Indicated resource is 6.54 Moz, with 1.82 Moz Inferred.
Construction is underway, with production scheduled for mid-2015. Production cash cost is $527/oz gold, so it can make good money at $1,000/oz gold. It is a surefire takeover candidate at some point. Companies like this are the stocks you want to watch very closely because if we see that final decline before the bottom, you can buy them at better prices then if you bought them right now or at $1,300/oz gold.
TGR: What other type of explorer/developer are you keen on?
JRB: Companies with multiple deposits. I'll name two. The first is Balmoral Resources Ltd. (BAR:TSX; BAMLF:OTCQX). Its stock has been a very strong performer recently. It has a great gold deposit, Martiniere, in a great jurisdiction, Quebec. Balmoral's value driver is its nickel-PGM discovery, Grasset, which has had some great results, including 1.85% nickel, 0.21% copper, 0.4 g/t platinum and 0.97 g/t palladium over 57.9 meters, announced Nov. 26. So Balmoral has two deposits, and it could spinoff Grasset into a new company if it wants or sell it and use that cash to really drill out Martiniere.
The company did a $10M financing this month. It is cashed up and has great management. Darin Wagner, the CEO, and his team are winners, and they know where to drill as evidenced by two tremendous discoveries.
TGR: What's the second?
JRB: That would be Cayden Resources Inc. (CYD:TSX.V; CDKNF:OTCQX), which was just taken out by Agnico Eagle Mines Ltd. (AEM:TSX; AEM:NYSE). Cayden had two value drivers in Mexico, Las Calles, which is something that Goldcorp Inc. (G:TSX; GG:NYSE) needs, and Morelos Sur, which has put out some great results. Even before the takeover, Cayden was a strong performer that held up really well during corrections.
TGR: Some shareholders in Cayden were disappointed because they thought the sale price of $205M was less than it was worth.
JRB: Over time, with a higher gold price and more drilling it would have been worth more. Today, it seems like a really good deal.
TGR: Besides taking out Cayden, Agnico has also, with Yamana Gold Inc. (YRI:TSX; AUY:NYSE; YAU:LSE), bought Osisko Gold. Has Agnico played a smart takeover game?
JRB: Agnico is very aggressive. Its stock was doing really well when things were booming. I think Agnico has done a good job making small investments in juniors and is well positioned for the future, assuming a big recovery. I was a little surprised by the Cayden buyout, but Cayden has really good grades in a top jurisdiction. I think Cayden is something of a one-off.
TGR: Which companies will lead the next wave of mergers and acquisitions (M&As)?
JRB: First off, I don't see a lot of M&As until we get a confirmed bottom in gold, when it rises above $1,300/oz, perhaps. That's what will persuade the majors that the bottom is in. At that time, their financials will be picking up, and that's when they can pick off some of the best assets. Maybe late 2015. Right now, most companies are trying to make sure they survive if gold goes below $1,100/oz.
TGR: What about the prospect of proactive takeovers by companies confident enough in gold's future to save $100M or $200M by acting now rather than waiting?
JRB: One possibility for that is Randgold Resources Ltd. (GOLD:NASDAQ; RRS:LSE). It has no debt and has been the best large gold miner over the last decade. Randgold has four producing mines and $500–700M in capital available to make acquisitions. There are many excellent targets in West Africa, so long as the Ebola situation doesn't spiral out of control there.
Another possibility, this one on the royalty/streaming side, is Franco-Nevada Corp. (FNV:TSX; FNV:NYSE). The company is so well capitalized and has been making a ton of deals over the last 12–18 months. Franco is making money and adding more streams and attributable production. Its stock has held up really well in a difficult time. 
TGR: With Franco buying all these streams, it's building in a lot of leverage to a high gold price, correct?
JRB: Absolutely. The one thing with Franco is that it tends to outperform at the very end of bear markets and then at the beginning of bull markets. This is a stock that should continue to perform really well, and if gold goes up, as I believe it will, it will benefit greatly, as will its partner companies. A higher gold price means that Franco won't have to worry about its partners getting into trouble.
TGR: Is there any particular event that investors should look for in the next couple of months to demonstrate that the worm has turned and that we're definitely into another bull market?
JRB: One thing investors should follow is the gold/S&P 500 ratio. Over the last 3.5 years there's been a severe negative correlation between these two asset classes. Money has for years flooded into the broader equities markets but not into precious metals. Right now, money is still flooding into equities generally but is exiting gold.
I think it's possible over the next couple of months we could see a potential blow-off move in the S&P 500. And if the gold/S&P 500 ratio rebounds significantly thereafter, that would be quite a signal. Another event would be gold falling to $1,000/oz and then making a monthly close above $1,200/oz. That would demonstrate to me that we're in a new bull market.
TGR: Jordan, thank you for your time and your insights.
Jordan Roy-ByrneJordan Roy-Byrne, CMT is a Chartered Market Technician and member of the Market Technicians Association. He is the publisher and editor ofTheDailyGold Premium, a publication that emphasizes market timing and stock selection for the sophisticated investor, as well as TheDailyGold Global,an add-on service for subscribers that covers global capital markets. Roy-Byrne's work has been featured in CNBC, Barron's, Financial Times, Alphaville, Kitco and Yahoo Finance. He is quoted regularly in Barron's. Roy-Byrne has been a speaker at PDAC, Cambridge House and Hard Assets conferences. TheDailyGold.com was recently named one of the top 50 Investment Blogs by Daily Reckoning.

Wednesday, 3 December 2014

Wednesday's Analytical Charts for Gold, Silver and Platinum and Palladium


All Quiet On The Golden Front


Gold continues to hold the $1,200 level, despite a stronger U.S. dollar and weaker oil prices overnight. The markets are awaiting the ECB meeting tomorrow for signs that Draghi announces a more formalized QE program. If the ECB stays the course, some squaring in the euro/dollar trade may prove beneficial for gold. The ETFs are also posting net inflows into the yellow metal, as funds may be adding some insurance against the lofty equity market. The next few weeks will see increased volatility as tax loss selling  enters the equation. This would be the time to speak to your accountants on the rules for this process, if your intention is to sell for a loss but maintain the underlying protection.
By Peter Hug 
The Oil-Drenched Black Swan, Part 1   


Given the presumed 17% expansion of the global economy since 2009, the tiny increases in production could not possibly flood the world in oil unless demand has cratered.

The term Black Swan shows up in all sorts of discussions, but what does it actually mean? Though the term has roots stretching back to the 16th century, today it refers to author Nassim Taleb's meaning as defined in his books, Fooled by Randomness: The Hidden Role of Chance in Life and in the Markets and The Black Swan: The Impact of the Highly Improbable:


"First, it is an outlier, as it lies outside the realm of regular expectations, because nothing in the past can convincingly point to its possibility. Second, it carries an extreme 'impact'. Third, in spite of its outlier status, human nature makes us concoct explanations for its occurrence after the fact, making it explainable and predictable."
Simply put, black swans areundirected and unpredicted. The Wikipedia entry lists three criteria based on Taleb's work:
1. The event is a surprise (to the observer).
2. The event has a major effect.
3. After the first recorded instance of the event, it is rationalized by hindsight, as if it could have been expected; that is, the relevant data were available but unaccounted for in risk mitigation programs.


It is my contention that the recent free-fall in the price of oil qualifies as a financial Black Swan. Let's go through the criteria:
1. How many analysts/pundits predicted the 37% decline in the price of oil, from $105/barrel in July to $66/barrel at the end of November? Perhaps somebody predicted a 37% drop in oil in the span of five months, but if so, I haven't run across their prediction.
For context, here is a chart of crude oil from 2010 to the present. Note that price has crashed through the support that held through the many crises of the past four years. The conclusion that this reflects a global decline in demand that characterizes recessions is undeniable.

I think we can fairly conclude that this free-fall in the price of oil qualifies as an outlieroutside the realm of regular expectations, unpredicted and unpredictable.
Why was it unpredictable? In the past, oil spikes tipped the global economy into recession. This is visible in this chart of oil since 2002; the 100+% spike in oil from $70+/barrel to $140+/barrel in a matter of months helped push the global economy into recession.
The mechanism is common-sense: every additional dollar that must be spent on energy is taken away from spending on other goods and services. As consumption tanks, over-extended borrowers and lenders implode, "risk-on" borrowing and speculation dry up and the economy slides into recession.

But the current global recession did not result from an oil spike. Indeed, oil prices have been trading in a narrow band for several years, as we can see in this chart from the Energy Information Agency (EIA) of the U.S. government.

Given the official denial that the global economy is recessionary, it is not surprising that the free-fall in oil surprised the official class of analysts and pundits. Since declaring the global economy is in recession is sacrilege, it was impossible for conventional analysts/pundits to foresee a 37% drop in oil in a few months.
As for the drop in oil having a major impact: we have barely begun to feel the full consequences. But even the initial impact--the domino-like collapse of the commodity complex--qualifies.
I will address the financial impacts tomorrow, but rest assured these may well dwarf the collapse of the commodity complex.
As for concocting explanations and rationalizations after the fact, consider the shaky factual foundations of the current raft of rationalizations. The primary explanation for the free-fall in oil is rising production has created a temporary oversupply of oil: the world is awash in crude oil because producers have jacked up production so much.
Even the most cursory review of the data finds little support for this rationalization. According to the EIA, the average global crude oil production (including OPEC and all non-OPEC) per year is as follows:
2008: 74.0 million barrels per day (MBD)
2009: 72.7 MBD
2010: 74.4 MBD
2011: 74.5 MBD
2012: 75.9 MBD
2013: 76.0 MBD
2014: 76.9 MBD
The EIA estimates the global economy expanded by an average of 2.7% every year in this time frame. Thus we can estimate in a back-of-the-envelope fashion that oil consumption and production might rise in parallel with the global economy.
In the six years from 2009 to 2014, oil production rose 3.9%, from 74 MBD to 76.9 MBD.Meanwhile, cumulative global growth at 2.7% annually added 17.3% to the global economy in the same six-year period. What is remarkable is not the extremely modest expansion of oil production but how this modest growth apparently enabled a much larger expansion of the global economy. ( Other sources set the growth of global GDP in excess of 20% over this time frame.)
Global petroleum and other liquids reflects a similar modest expansion: from 89.1 MBD in 2012 to 91.4 MBD in 2014.
Given the presumed 17% to 20+% expansion of the global economy since 2009, the small increases in production could not possibly flood the world in oil unless demand has cratered. The "we're pumping so much oil" rationalizations for the 37% free-fall in oil don't hold up.
That leaves a sharp drop in demand and the rats fleeing the sinking ship exit from "risk-on" trades as the only explanations left. We will discuss these later in the week.
Those who doubt the eventual impact of this free-fall drop in oil prices might want to review The Smith Uncertainty Principle (yes, it's my work):

Every sustained action has more than one consequence. Some consequences will appear positive for a time before revealing their destructive nature. Some will be foreseeable, some will not. Some will be controllable, some will not. Those that are unforeseen and uncontrollable will trigger waves of other unforeseen and uncontrollable consequences."
Analyzing Monday’s Massive Swings In Gold & Silver

Is Monday's volatility a signal or just noise?

Though just two days in, this week is already shaping up to be one of the most volatile for gold and silver in a while. On Monday, prices briefly plummeted; gold hit a low of $1,143, while silver touched a five-year low at $14.29. Then, just as fast as it fell, the duo zoomed back up, spiking as high as $1,222 and $16.81 for gold and silver, respectively.
Gold 

As is often the case during volatile moments in the market, there were numerous explanations for the day's furious trading action. One such explanation centered around oil; gold and silver simply followed oil down--and then back up--as crude prices gyrated after hitting the lowest levels since 2009 early on Monday.
Another explanation pointed to the failure of a referendum on gold in Switzerland and a credit downgrade in Japan as sparking the volatility. Swiss voters rejected a proposal that would have required the central bank to purchase more gold, sending prices initially lower. Later in the day, Moody's cut Japan's sovereign credit rating from AA3 to A1, helping to send prices back up.
A Lot Of ‘Noise’
Then there's always the convenient "short covering" explanation that commentators like to throw around to explain any sudden, unexpected movements in the markets.
All that said, what prompted Monday's price swings wasn’t that relevant from a bigger-picture perspective. The fact is, gold has been holding near the $1,200 level for some time now, at around the same price that the yellow metal began the year.

None of the recent events--oil's decline, the Swiss vote, Moody's Japan downgrade or any other factor--has been able to break gold out of its comfort zone and ignite a consistent trend (either up or down) in prices. That makes these events essentially "noise," and gold should be considered trendless until a bigger catalyst emerges.

What Does the End of QE3 Really Mean?

Arkadiusz Sieron

So it finally happened. The Federal Reserve ended its Quantitative Easing program on October 29, 2014 due to concerns that keeping QE for so long could fuel excessive risk-taking by investors. The U.S. dollar continued to conquer new heights, while gold did not welcome this central bank action. Its price fell in November to $1,142, a four-year low. This is not surprising given the fact that as we wrote (in the last Market Overview), the condition of the U.S. dollar is one of the most important drivers of gold prices.
However, the future (in the medium term) of the yellow metal’s price in the post-QE world is unclear. So much is unknown. When will Fed hike the interest rates? Is the U.S. central bank going to get rid of the enormous level of assets it bought? How and when does it plan to do so? How will the financial market perform without stimulus? Is the end of QE really a sign of a strong U.S. recovery? Some analysts agree, forecasting that gold will fall towards the $800-$900 level, while other economists fear that without Fed’s bond-buying program, a market crash may be on its way, leading to renewed investors’ interest in gold. 
As a result, markets are confused right now. In this edition of Market Overview we try to clarify concerns about the impact of the end of QE3 on the U.S. economy and gold market. But first, let’s analyze what the recent halt of QE really means.
The quantitative easing was an unconventional monetary policy of buying financial assets from commercial banks. It increased the monetary base, Fed’s balance sheet and prices of purchased assets, decreasing their yields. The third, and for now the last, round of quantitative easing was announced on September 13, 2012 without stating the end date. Initially, the program involved purchases of agency mortgage-backed securities at a pace of $40 billion per month, but was extended to purchases of Treasuries involving $45 billion per month. In this largest asset-buying program, the Fed purchased assets worth around $1.6 trillion, expanding its balance sheet to about $4.5 trillion.
Graph 1: Fed’s assets (in millions of dollars) from 2002 to 2014
Theoretically, the halt of QE3 means the end of the multi-year asset purchases. However, not completely, because the “Committee is maintaining its existing policy of reinvesting principal payments from its holdings of agency debt and agency mortgage-backed securities in agency mortgage-backed securities and of rolling over maturing Treasury securities at auction,” as seen in the statement released by the Fed on October 29, 2014. It implies that although the Fed discontinued expanding its balance sheet, it will not allow it to shrink, at least for some time. And we are not talking about small amounts. According to Treasury Borrowing Advisory Committee estimates, if the Fed decides not to roll Treasuries (large amounts of them start maturing in 2016) over into new debt, the Treasury would be forced to borrow an extra $675 billion from the public over a three-year period. Therefore, the end of QE3 does not imply the end of quantitative easing. To use a metaphor, ending QE is not putting on the brakes; it is just easing off the accelerator.
However, even the complete reversal of QE3 would not mean the abandonment of the quantitative easing concept. The asset-buying program has become an established part of the Fed’s policy that could be implemented again in times of crises. Fed Chairwoman Janet Yellen has already said explicitly that she would not rule out more assets buying if needed. It is not coincidence that we have witnessed three rounds of the quantitative easing. We hope you remember that after the end of QE1 in March, 2010, there was a substantial correction in stocks (just under 20%), leading the U.S. central bank to start QE2. Then, after the halt of QE2 in June, 2012, there was another important stock market decline (about 20%), and that was the reason why the Fed launched the third round of QE. Given the fragile nature of the global economy, if asset prices fall or economic growth falters, we could witness QE4, especially since the Fed’s actions are data driven.
We focus on the U.S. central bank’s policy and its implications for the gold market in our monthly Market Overview reports and we invite you to check them out. We also provide Gold & Silver Trading Alerts for traders interested more in the short-term prospects. If you’re not ready to subscribe now, we still encourage you to join our gold newsletter. It’s free and you can unsubscribe in just a few clicks.

SILVER Elliott Wave Technical Analysis – 1st December, 2014

Lara Iriarte
Posted Dec 3, 2014

Downwards movement invalidated both daily Elliott wave counts, published two days ago. This Elliott wave count is updated and still expects upwards movement.
(Click on image to enlarge)
At 18.430 minute wave iii would reach 2.618 the length of minute wave i. This is close to the 0.618 Fibonacci ratio of minor wave 1 at 18.812. The target may be about two weeks away.