Friday, 16 January 2015

Gold: Key Upside Breakout

Morris Hubbartt


Morris

Friday, Jan 16, 2015 Super Force Signals special offer for 321Gold Readers:
Send an email  and I’ll send you 3 of my next Super Force Surge Signals free of charge, as I send them to paid subscribers. Thank you!
The SuperForce Proprietary SURGE index SIGNALS:

25 Surge Index Buy or 25 Surge Index Sell: Solid Power.
50 Surge Index Buy or 50 Surge Index Sell: Stronger Power.
75 Surge Index Buy or 75 Surge Index Sell: Maximum Power.
100 Surge Index Buy or 100 Surge Index Sell: "Over The Top" Power.

Stay alert for our surge signals, sent by email to subscribers, for both the daily charts on Super Force Signals
and for the 60 minute charts at

About Super Force Signals
:
Our Surge Index Signals are created thru our proprietary blend of the highest quality technical analysis and many years of successful business building. We are two business owners with excellent synergy. We understand risk and reward. Our subscribers are generally successfully business owners, people like yourself with speculative funds, looking for serious management of your risk and reward in the market.


Frank Johnson: Executive Editor, Macro Risk Manager.
Morris Hubbartt: Chief Market Analyst, Trading Risk Specialist.

The Diving Loonie

David Chapman

Charts created using Omega TradeStation 2000i. Chart data supplied by Dial Data

Yes loons dive. Canada's iconic bird is featured on stamps and coins. The picture of a loon on Canada's $1 coin earned it the nickname of "the loonie". Those who have visited Canada's lakes are familiar with the sound of loons. There is hardly a lake in Canada that wouldn't be the same without the sound of the iconic loons. Oh yes they also dive. Loons dive to get their food. Ok they are not in the same class as cormorants but they can hold their breath for upwards of 90 seconds.
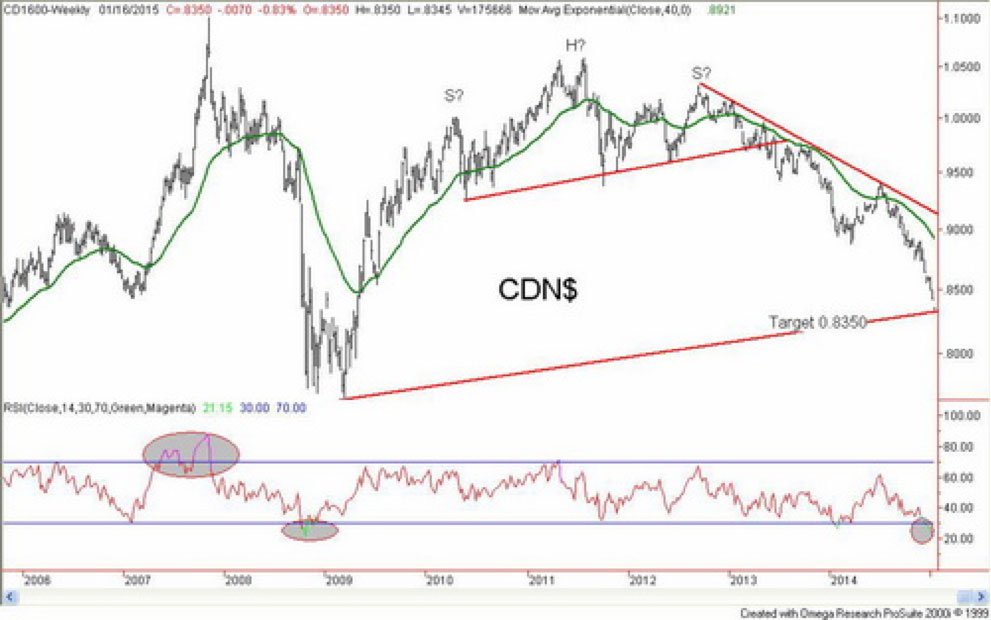
But this isn't about Canada's iconic bird. It's about another kind of loon. The Cdn$ aka "the loonie". And it has been diving. No word that it is going down to find food though. And unlike the loon the loonie appears to be able to hold its breath for months.
The decline of the loonie got underway in May 2013. The loonie broke down from what appears as a possible large head and shoulders top pattern. The decline initially was slow but picked up pace in the latter part of 2013 falling from around 0.97 to under 0.90 by March 2014. At that point, a strong rebound got underway and by July 2014 had recovered to around 0.94. With collapsing oil prices, the loonie started a steep decline currently falling to around 0.8350. Since hitting a high near 1.06 in July 2011 the loonie has lost roughly 21% against the US$. But is it now approaching a potential bottom? The potential objective from the head and shoulders top pattern was 0.8350. The loonie is there.
The reasons for the decline of the loonie are varied but in the early going it appeared to be Canada's relative economic underperformance as compared to the US. The most recent decline is attributed to collapsing oil and commodity prices. Canada is a major exporter of oil and with a collapse in oil prices from $107 to $45 it has had a negative impact on Canada. Already job losses are being seen in Canada's western oil patch (Suncor Energy (SU-TSX) announced that 1,000 jobs are to be cut along with about $1 billion to be cut from its capital budget). Some are predicting that Alberta could soon enter a recession. The oil price collapse could have a negative impact on the housing market.
The collapse of oil prices has also negatively impacted tax revenues for oil producing provinces (Alberta, Newfoundland, Saskatchewan) as well as the Federal government. Alberta's surplus has been wiped out. Newfoundland's deficit is growing. Saskatchewan is experiencing problems and some are predicting that the Federal government's balanced budget is in deep trouble with potentially two more years of deficits. How the Federal Government who had promised a balanced budget by election 2015 in October will respond is anybody's guess.
But collapsing oil prices and loonie are not all bad. Both Ontario and Quebec could benefit from lower oil prices and a lower loonie as it could help their export sector. With the loonie holding higher in recent years Canada's exporters should be more productive now and a lower loonie should work to their benefit. On the other hand, snowbirds and others who like to travel to the US are no doubt paying higher prices. Canadian professional teams in hockey, basketball and baseball are also facing a higher bill as they pay their salaries in US$.
It has not just been oil prices that have been falling. Other commodity prices are falling as well. Copper prices have fallen 21% since the high of 2014. Copper has fallen 8% in 2015 thus far. Many are pointing to the falling copper price as a sign that the world economy is tipping over. The TSX Metals & Mining Index is down almost 23% in 2015, the TSX Composite is down only 5%. Commodity prices are priced in US$. With the Cdn$ down the fall in commodity prices expressed in Cdn$ has not been as steep. Since December 31, 2014 oil prices have fallen $7.38 or 13.9%. But in Cdn$ oil prices have only fallen $6.97 or 11.3%. The loonie may be diving but it is softening the collapse in commodity prices.
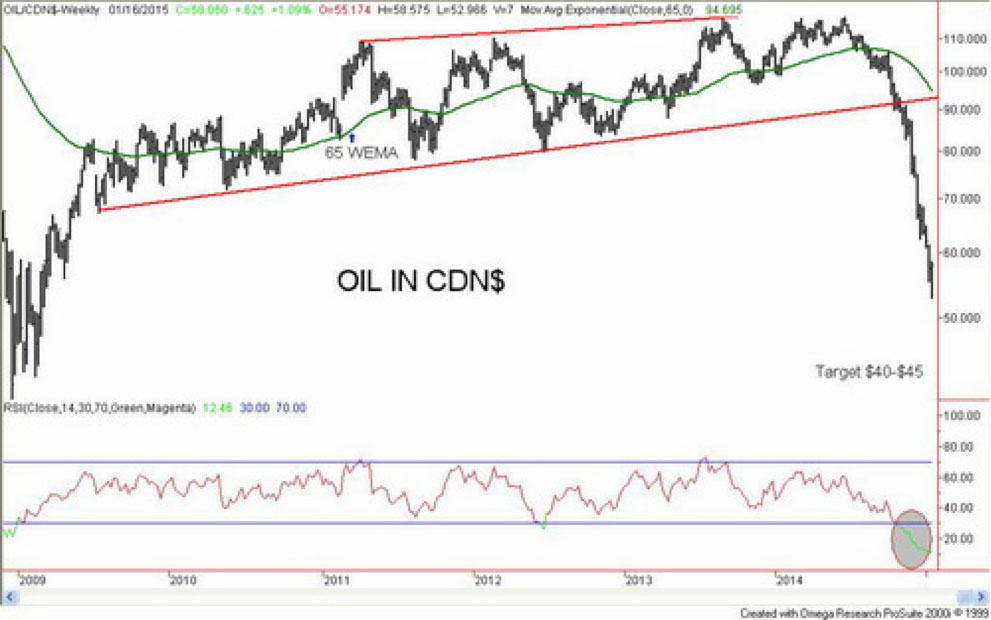
Oil expressed in Cdn$ has a potential objective down to between $40 to $45 based on the topping pattern that formed between June 2009 and October 2014. That suggests that oil in Cdn$ has more distance to fall. Since oil in US$ also has a target zone of $40 to $45 the fact that oil in Cdn$ also has that target zone then oil in US$ could have even further to fall under $40. Or the currencies have to even out. Either way it suggests the potential for more pain ahead in the oil market even if it does rebound for a period. A collapsing oil price along with collapsing commodity prices is deflationary.
Charts created using Omega TradeStation 2000i. Chart data supplied by Dial Data
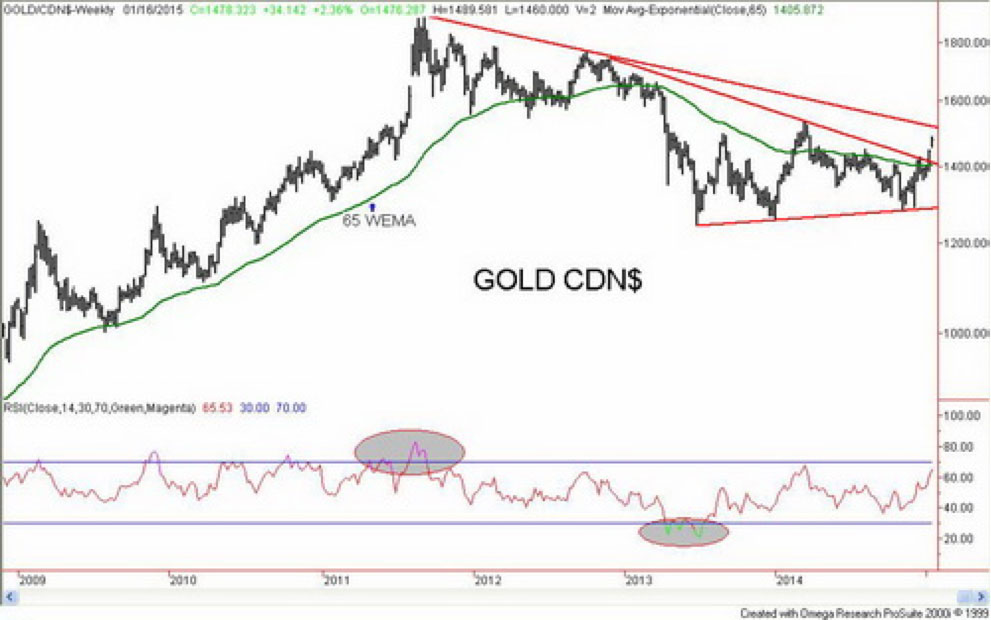
Since December 31, 2015 gold prices have rallied $50.40 in US$ terms or 4.3%. But expressed in Cdn$ gold prices are up $101.98 or 7.4%. In 2014 gold was only down against one currency - the US$ and that was only a small 1.5%. Against the Cdn$ in 2014 gold was up about 6%. This is significant because what that meant was that gold was up in 2014 against all currencies except the US$. Since the beginning of the year gold is rising in US$ even as the US$ continues to rise against other currencies.
Gold expressed in Cdn$ may be poised to make a major breakout. Gold in Cdn$ recently broke above a downtrend line from the 2012 high. There is a second downtrend line from the 2011 high. Gold in Cdn$ would need to breakout over $1,515 to take out that trendline. A breakout over that level could be significant. A projection for gold's price in Cdn$ could be up to $1,900 or even up to $2,200. Those prices are gold expressed in Cdn$ but it does not say anything about the US$ exchange rate.
For comparison sake gold in US$ could be on the cusp of breaking above the downtrend line from the 2012 high. That line is currently at around $1,240 although a breakout over $1,280 would confirm. As to the downtrend line from the 2011 high, gold needs to breakout over $1,525. With gold in US$ currently hovering just below $1,240 the gold market could be on the cusp of either a significant breakout or failure.
Charts created using Omega TradeStation 2000i. Chart data supplied by Dial Data
A bull market for gold would suggest that gold would need to be rising in all currencies. With gold now rising in US$ even as the US$ continues to rise is a potential significant development. However, there is considerable work to be done by gold before a real bull market emerges. Failure at any of the above levels could suggest a return to test the lows or even new lows.
The loonie is quite oversold here. But that doesn't mean it's about to rebound. Oil is also grossly oversold here and it is possible a rebound could be get underway. But for both the loonie and for oil there are few if any signs of a bottom. The Cdn$ needs to recover above 0.90 to even suggest a potentially stronger rebound. A break under 0.8250 might suggest a move down to 0.80 or even 0.77. During the 2008 financial crash, it took several weeks before the loonie found its footing and started to take flight again.
The loonie is diving. But gold in Cdn$ is rising. Gold is rising against a host of currencies. The initial rush everywhere has been into US$. But when gold starts rising in US$ even as the US$ continues to rise against other currencies it is a sign that there are potentially deeper problems brewing. There are few predicting that the oil price collapse might not have negative repercussions for the global economy. The same can be said about falling commodity prices and falling currencies. What needs to be understood is that all of this is suggesting that something is deeply amiss and currencies and by extension the central banks and governments are not being trusted. With gold now rising in US$ terms as well it could be the final nail.

Silver Ready to Run

Adam Hamilton


Silver looks to be on the verge of a major new upleg, finally emerging from the past couple years' ugly sentiment wasteland. This beleaguered precious metal recently bottomed as futures speculators threw in the towel on their extreme shorting. And while investors' ongoing silver stealth buying continues, it's been modest. So there is vast room for capital inflows to accelerate dramatically as gold mean reverts higher.
Silver has always had a special allure for hardened contrarian investors. Its price action is exceptionally volatile, with massive rallies erupting from time to time that multiply capital deployed in it. With silver's relatively-small market size, it doesn't take a lot of new investment buying to catapult prices higher. And shifting sentiment, a powerful self-feeding motivator, fuels the big swings in capital flows that really move silver.
When investors wax bullish on this white metal, its price soars with a fury few other investments can match. Later when silver falls out of favor again, prices collapse. And that's the miserable story of the past couple years. Silver dropped 19.7% in 2014 after plunging a brutal 35.6% in 2013. Such dismal performance naturally left silver universally despised, the pariah of the investment world. But that is changing.
Silver is ready to run again, a very exciting prospect given the huge uplegs it is renowned for. Silver's fundamentals are quite unique. Though it is primarily an industrial metal with steady global supply and demand, investment capital can slosh in and out in a big way. The bullish sentiment that's necessary to trigger big silver demand spikes comes from one thing, gold prices. Gold dominates silver psychology.
When gold is weak like during recent years, investors shun silver so its price crumbles and languishes. But when gold strengthens, investors flood back into the white metal. Silver leverages and amplifies gold's gains, making it one of the best investments when gold is returning to favor. And gold's long-overdue mean-reversion rebound upleg out of recent years' crazy anomalous lows is now underway.
While ultimately gold drives silver through that sentiment link, the daily capital flows responsible for most of the white metal's price action largely come through two major conduits. Stock investors add or shed silver exposure by buying or selling shares in the iShares Silver Trust, the flagship silver ETF that trades as SLV. And silver futures are the epicenter of speculation, where traders make big leveraged bets.
Both the levels of SLV's physical-silver-bullion holdings and American speculators' aggregate long and short contracts in silver futures reveal silver is almost certainly embarking on a major new upleg. Each of these critical capital pipelines into silver shows great room for more investor and speculator buying. And that will come as gold continues recovering on balance, unwinding its extreme anomaly of recent years.
Since the pools of stock-market capital are so vast, let's start with SLV. This ETF's mission is to track the price of silver so stock investors can gain diversifying exposure in their portfolios. Since the supply and demand for SLV shares almost never exactly matches that of underlying silver, differential buying and selling of ETF shares develops. If not addressed, it would soon force SLV to decouple from silver and fail.
In order to keep SLV share prices closely mirroring the silver price, this ETF's custodians have to quickly equalize any excess share supply and demand into silver bullion itself. When stock investors buy SLV shares faster than silver is being bought, SLV threatens to decouple to the upside. So its custodians issue new shares, adding supply to satisfy this excess demand. The cash raised is used to buy silver bullion.
Conversely when SLV shares are being sold faster than silver, it will soon fail to the downside. The only way to prevent this is to equalize the excess SLV-share supply into silver itself. SLV's custodians do this by buying back excess SLV shares, with these purchases funded by selling some of the silver bullion held in trust for SLV shareholders. Thus SLV holdings levels are a key barometer of silver demand.
And they now reveal low stock-investor exposure to silver prices, which is very bullish since that leaves lots of room for new buying as gold continues recovering. This first chart shows SLV's physical-silver-bullion holdings in red, with SLV prices superimposed on top in blue. As stock investors see gold and therefore silver starting to move decisively higher, they are likely to buy tens of millions of ounces in short order.
Silver's last mini-mania peaked in April 2011, above $48 per ounce. For most of the time since, silver has been grinding lower on balance. As of early November 2014 in SLV terms, silver had fallen a brutal 69.7% over 3.5 years. That powerful bear market left silver universally loathed, deeply out of favor with investors and speculators. Most assumed that vexing downward spiral would persist indefinitely.
But considering how rotten and epically bearish silver sentiment has been, the trend in SLV's holdings has been rather amazing. Since way back in May 2012, years before silver would finally bottom, the bullion that SLV holds in trust for its shareholders has risen on balance. That means stock investors were buying SLV shares faster than silver was being bought, or selling them slower than it was being sold.
This contrary uptrend has witnessed dazzling episodes of strong differential buying, most notably in early 2013, mid-2013, and late 2014. Unfortunately silver prices didn't respond super-favorably to any of these since American futures speculators were dumping vast amounts of silver contracts at the same times. But if these speculators had merely been neutral on silver, its price would have soared on SLV buying.
But after SLV's holdings hit a relatively-high 350.2m ounces as December 2014 dawned, this ETF was slammed by heavy year-end differential selling pressure. That month alone its holdings fell 5.3%, and were down 6.8% total by last week. That represents massive silver selling pressure of 23.8m ounces. And the reason for this is easy to understand. Silver had really underperformed, and institutions dominate SLV.
Pension funds, mutual funds, and hedge funds are the largest SLV shareholders by far. They always want to show winners on their trading books as years end, when many investors make decisions about which funds to allocate capital to. So there is lots of so-called window dressing in December, funds buying high-performing stocks while selling laggards. With SLV down 19.5% last year, it was sure the latter.
In addition, in early November silver had just slumped to a deep new 4.7-year low on extreme futures shorting. Bearishness was off-the-charts epic, with virtually everyone convinced silver was doomed to spiral lower indefinitely. So I suspect plenty of fund managers capitulated after that, saying the heck with silver. Their exit certainly contributed to the major differential selling pressure SLV suffered last month.
But actually lower SLV holdings are bullish. They imply stock investors are way underexposed to silver, and leave lots of room for capital to migrate back in. With gold recovering, the odds are very high that stock investors will soon return to SLV in a serious way. The resulting differential buying pressure on SLV shares should easily blast this ETF's holdings back up near their multi-year resistance near 352m ounces.
That would require 25.6m ounces of stock-investor silver buying in short order, a big number. To put this in perspective, the venerable Silver Institute reported total global silver investment demand in 2013 of 256.0m ounces. That equates to 21.3m per month. SLV's holdings are poised to quickly surge by at least 25m, likely in a matter of weeks. This is big marginal investment demand in such a short period of time!
And that projection is far too conservative. Note above that SLV's holdings surged up to or over their uptrend's resistance when silver prices were quite weak. Imagine how much more intense the stock-investor silver buying through SLV will be if silver is actually surging. I fully expect that this year SLV's holdings will easily surpass their all-time record high of 366.2m ounces achieved back in April 2011.
That would require enough differential buying of SLV shares to force its holdings 39.8m ounces higher, a massive boost in investment demand. And even at that old record, the amount of capital parked in SLV would still be small. Since silver prices were so high that last time silver was really in favor, SLV's silver bullion held in trust for its shareholders was worth $17.2b. But silver is priced far lower these days.
So the same record SLV holdings levels would be worth merely $6.2b today, just over a third as much. And capital measured in single-digit billions is a trivial drop in the bucket for the stock markets. It will only take a tiny fraction of stock investors parking some diversifying capital in SLV to blast its holdings dramatically higher. And all the resulting ETF underlying physical bullion buying will accelerate silver's upleg.
In the investing world, nothing begets demand like higher prices. Investors don't want to own anything until it is already rallying, and the longer and higher it climbs the more they buy. So uplegs in silver, and anything really, tend to be self-feeding. Buying drives prices higher, which entices in still more buyers, which lifts prices even higher, and the cycle grows. So silver investing via SLV has vast upside potential.
But in recent years stock-investor capital alone has proved insufficient to ignite a major silver rally. And that is where silver's dominant day-to-day price driver comes in, the silver futures trading by American speculators. With investors largely missing in action still after silver's excessively-weak past couple years, futures speculators' trading is silver's primary driver. This critical relationship is crystal-clear in this next chart.
It shows American speculators' total long and short contracts in silver futures on a weekly basis as reported by the CFTC in its famous Commitments of Traders reports. The green line is the total long contracts speculators hold, bullish bets on silver prices. And the red line is their total shorts, the bearish bets. The yellow line shows both series' deviation from normal years' averages, while SLV is rendered in blue again.
Silver's extreme 4.7-year lows back in early November were solely the result of extreme selling by those American futures speculators. They effectively capitulated, convincing themselves the universal hyper-bearish outlook for silver was righteous. So they aggressively shed long contracts while spectacularly ramping shorts, subjecting silver to withering selling pressure. It's impressive silver didn't crater much lower.
Back in July after gold surged on the Fed's Janet Yellen claiming there was no inflation, speculators' leveraged long-side bets on silver hit a 3.7-year high of 90.3k contracts. But as bearishness set in again thanks to heavy gold-futures shorting, their longs collapsed by 20.5% or 18.5k contracts by early December. With each contract controlling 5000 ounces of silver, that was a lot of selling for the markets to absorb.
We are talking about a staggering 92.6m ounces slamming the markets in less than 5 months! It's no wonder silver slumped to major new lows under such a massive onslaught. But it gets even worse, as the new shorting by speculators was far more extreme than their long liquidation. Between late July and early November, speculators' total shorts skyrocketed an astounding 166.2% or 43.7k contracts!
Now in the futures markets, the price impact of an existing long contract being sold or a new short one being added is identical. So speculators shorting 43.7k new contracts deluged the markets with a truly mind-boggling 218.5m ounces of silver in just over 3 months! That is the equivalent to over 5/6ths of 2013's total global investment demand. Silver's resiliency despite that epic selling was actually amazing.
Silver's secular bull was born back in November 2001 at just $4 an ounce, and our weekly CoT data on futures speculators' positions extends back farther to January 1999. Speculators' bearish bets on silver in early November of 70.0k contracts was the highest ever seen since at least then. I suspect it was an all-time record high! Speculators had likely never been more bearish, never more leveraged against silver.
But since silver's swoon was relatively mild compared to that mammoth futures selling, there had to be great latent investor demand out there absorbing that torrent of supply. The fact that investors were quietly buying when everyone was convinced silver was doomed is super-bullish. Their ranks and capital inflows will swell dramatically as gold continues mean reverting back up to far-higher normal levels.
And speculator futures buying is going to fuel the early gains before investors fully take the baton in silver's next mighty upleg. Since silver futures are so highly leveraged, selling them short is an exceedingly-risky bet. Today the CME Group only requires margin of $6500 on deposit for each silver-futures contract speculators hold. But at $17 silver, a 5000-ounce contract is worth $85,000. That's leverage of 13.1x!
Stock speculators have been legally limited to 2-to-1 leverage since 1974, 13 to 1 is crazy. Speculators who run minimum margin will lose 100% of their capital risked if silver merely moves 7.6% against their bet. And silver's super-volatile history shows it doesn't take long, a day or two, for such big swings to erupt. This risk is particularly acute for the speculators short silver, since they legally have to buy to cover.
Shorting requires speculators to effectively borrow silver before they sell it, with the hope of buying it back later at lower prices to repay their debts. The only way to settle those debts is to close their short contracts by buying offsetting longs. This buying is compulsory as silver rallies and erodes their capital risked, so they quickly buy to cover. And as you can see, the short covering has already been fast and furious.
But it's not over yet! In the latest CoT week, speculators were still short 35.9k contracts. This remained well above their average short levels of 21.5k in the normal years between 2009 to 2012. So merely to mean revert to those norms, not even overshoot in the other direction which is always the case after extremes, they still have to buy to cover another 14.4k contracts. That equates to another 72.1m ounces of buying!
Meanwhile the long-side speculators will get more bullish and bold as silver rebounds, partially on short covering. They will ramp up their bets again, inevitably pushing their total contracts back up near long-side uptrend resistance around 93k contracts. That would require 17.5k contracts of buying, or another 87.4m ounces. And don't forget the 39.8m or so likely coming from stock traders through SLV very soon.
Add speculator short covering, long contracts rebounding, and stock-investor SLV buying, and silver is looking at potential near-term buying over the coming few months of a staggering 199.3m ounces! That is the equivalent of nearly 4/5ths of the entire silver investment demand for all of 2013. The potential silver upleg that much buying in a relatively short period of time would fuel is massive. Silver is truly ready to run.
And really that's just the start. Traditional silver investing doesn't come through silver futures or ETFs, but through physical bars and coins. And once the futures buying and ETF buying pushes silver high enough for long enough to convince investors this new upleg is the real deal, traditional physical demand will soar and take the baton. Futures and ETF buying really just jump starts the even-larger main show.
With silver's prospects out of its recent extreme lows looking so incredibly bullish, all investors need to get silver exposure in their portfolios. Physical silver bars and coins, and even SLV, are fine ways to do it. But their upside is limited to silver's gains, they can't leverage it. Meanwhile the best of the silver miners' and explorers' stocks will amplify silver's upleg by multiples, potentially earning fortunes for investors.
At Zeal we can help you pick those winners. Our latest comprehensive report on the silver stocks with the best fundamentals was published just over a year ago, and is now available for just $49. Buy yours today and get deployed before silver soars! There aren't many analysts in the entire world with more experience analyzing and trading precious-metals stocks than we have at Zeal. Put us in your corner.
We also publish acclaimed weekly and monthly subscription newsletters for contrarian speculators and investors. They draw on our decades of hard-won experience, knowledge, wisdom, and ongoing research to explain what's going on in the markets, why, and how to trade them with specific stocks. With major changes afoot in the markets, it's never been more important to cultivate a studied contrarian perspective. Subscribe today!
The bottom line is silver is ready to run higher in a major new upleg. Silver is ultimately driven by gold's fortunes, so as gold continues mean reverting higher silver is going to catch a massive bid. This buying will initially come from American stock traders and futures speculators. They will aggressively buy SLV shares faster than silver is being bought, cover still-large silver-futures shorts, and add new silver-futures longs.
This major buying, likely to approach a couple-hundred million ounces in a matter of months, will serve to launch silver higher. And nothing attracts investors like rallying prices, so global investment demand will ramp dramatically. Investors are so underexposed to silver after leaving it for dead in recent years that they will need enormous buying to attain any reasonable silver exposure. Silver will soar on these inflows.

Wednesday, 14 January 2015

Gyrations


Gold found some upside impetus early in the day before falling. It bounced up to 1245 before settling down for a small loss during afternoon trading. Silver prices were hit by a round of profit-taking only a day after gold experienced the same impulse. The gray metal is off over 1%.
The muscular uptick in oil helped temper enthusiasm for gold. It also helped to trim losses on the equities exchanges. Lackluster retail sales also dragged down the Dow and S&P, although stocks were down globally as investors are trying to scope out exactly where the world economy is headed in 2015.
They’re not coming up with any definitive answers.
It’s no wonder. Everywhere mixed messages are being transmitted o the trading communities. China is slowing down in manufacturing, but exports soared. Inventory reduction? The U.S. is seeing solid employment gains but retail sales disappointed, falling almost 1% for December year-on-year. Japan remains stuck in the doldrums and Europe lacks vision and will, although Germany, and surprisingly Great Britain remain solid players, even if growth is a tad slow.
Yet the Japanese yen is being perceived as the safe haven of choice these days, hurting gold’s comeback.
Moreover, the World Bank on Tuesday lowered its global growth forecast for 2015 and 2016 citing disappointing economic prospects in the euro zone, Japan and some major emerging economies that offset the benefit of lower oil prices. The only BRIC country showing robust growth is India, but India has a long way up to go, so that’s no surprise.
We are liable to hear more calls from Europe to ease the sanctions on Russia over the Ukraine impasse. Of course, those calls may be buried under the avalanche of work that needs to be done on the continent concerning the latest terror threat. We still predict military action in Yemen. It’s gotten out of hand.
We are also unsure of oil’s stability. More softness will begin to pinch the equities in the U.S. even more, and soon may hurt employment. The oil patch and its associated industries provide a good chunk of jobs, almost all of which are well paid.

Wishing you as always, good trading,
Gary Wagner

Gold stocks during an equity bear market

Steve Saville

The historical record indicates that the gold-mining sector performs very well during the first 18-24 months of a general equity bear market as long as the average gold-mining stock is not 'overbought' and over-valued at the beginning of the bear market. Unfortunately, the historical sample size is small. In fact, since the birth of the current monetary system there have been only two relevant cases.
The first case involves the general equity bear market that began in January of 1973 and continued until late-1974. This bear market resulted in peak-to-trough losses of around 50% for the senior US stock indices.
The following chart comparison of the Barrons Gold Mining Index (BGMI) and the S&P500 Index shows that the gold-mining sector commenced a strong upward trend near the start of the general equity bear market. During the bear market's first 20 months, the BGMI gained about 300%.
The second case involves the general equity bear market that began in September of 2000 and continued until early-2003. This bear market also resulted in peak-to-trough losses of around 50% for the senior US stock indices.
The following chart comparison of the HUI and the NYSE Composite Index (NYA) shows that the gold-mining sector commenced a strong upward trend about 2.5 months after the start of the general equity bear market. Despite the fact that the HUI suffered a substantial percentage decline during this 2.5-month period, it still managed to gain about 200% over the course of the bear market's first 20 months.
The gold-mining sector is currently a long way from being 'overbought' and over-valued. In fact, by some measures it was recently as 'oversold' as it ever gets. The historical cases cited above would therefore be relevant if a general equity bear market were to begin in the near future.
On a related matter, the only times when the owners of gold-mining stocks need to fear a general equity bear market are those times when the gold-mining sector has trended upward with the broad stock market during the 6-12 months prior to the start of the general equity bear market. Consequently, in the unlikely event that the current bull market in US equities continues for another 6-12 months and gold-mining stocks trend upward during that period, the gold-mining sector will then be vulnerable to the downward pull of a general equity decline.

Crude Oil Supply and Demand

Share Button
We don’t normally analyze the crude oil market. However, there has been a huge price move (which may not be complete yet). With the endless rumors of deals that explain the move, we thought we would look at the spreads. The data shows a startling picture.
You should approach supply and demand in this market similarly to gold and silver. The difference is that there is very little inventory buffered in the system. Notwithstanding what you read about China “buying up” the oil to take advantage of “cheap” prices, oil requires specialized storage facilities. There is a significant cost to store it, and finite capacity too.
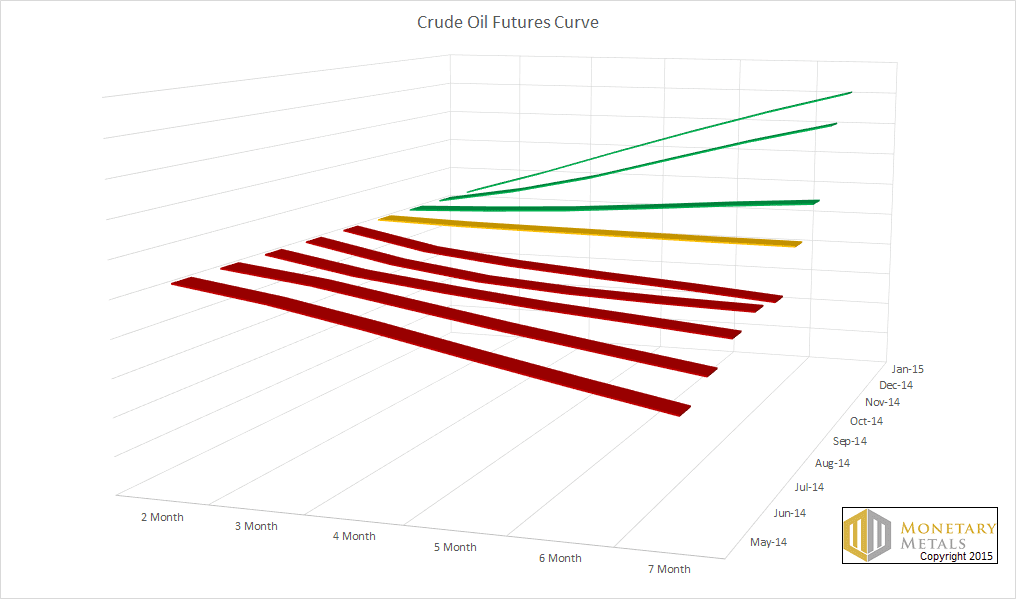
Below is a 3D graph of the futures curve taken at various times, from before the crash through January 9. Each line represents the curve at a given moment. Red lines are where there is backwardation. Yellow is a flat curve. And green indicates contango. Unlike our regular Supply and Demand Report for gold and silver, this shows just the price of various futures contracts and does not compare to the spot price. So here, backwardation is when a farther-out contract is cheaper than a nearer one. Contango is when the nearer one is cheaper. As with the monetary metals, backwardation is a sign of shortage, and contango is a sign of adequate or abundant supply.
Crude Futures Curves
You can see backwardation from May through September, with a gradual lessening of the slope. What really stands out is that, abruptly, the backwardation disappeared.
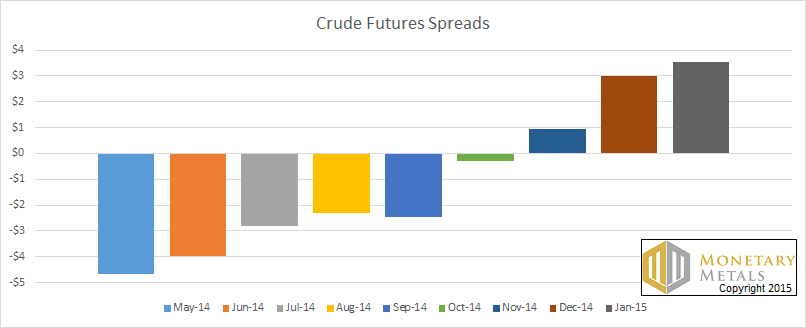
Here is another graph, showing the total spread included in each future curve (measured in dollars per barrel).
Crude Futures Speads
In May, there was nearly a $5 premium of the near contact over the distant contract. Now, there is over a $3 premium for the distant one. That is a picture of a market in shortage turning into a market without a shortage.
Contango is normal. It costs to store oil, and so if you want someone to deliver it to you 7 months out, you will have to pay him to cover this cost plus a profit. Otherwise why should he do that for you? When you buy a futures contract, that is what you are ordering—storage and delivery on a date.
Here is a graph of the price. The correlation to the changing spread is obvious.

Gold Stocks: Rally Acceleration!

Stewart Thomson

  1. I expect global jewellery demand to support consistently higher gold prices, well into the month of February. That’s partly because Chinese stock markets had a tremendous performance in 2014.
  2. Investors in China appear keen to celebrate the New Year by purchasing enormous amounts of gold jewellery.

  3. Please click here now. That’s the daily gold chart. A key breakout has occurred, and gold should make its way to $1350 over the next month or two.

  4. Please click here now. I’ve predicted that trading volume in China’s gold markets will surpass the volume on the COMEX over the next two to three years.
  5. As that happens, I expect gold to trade with less volatility, but horrific geopolitical events involving Al Qaeda and ISIS could bring brief periods of time where gold trades “wildly” higher, and then sharply lower.

  6. As powerful as Chinese demand is, I think most gold investors are underestimating what could become an even bigger source of demand and gold price discovery, which is Dubai.

  7. Please click here now. Dubai is launching a new gold jewellery expansion program, targeting international businesses (B2B).

  8. I expect that program will drive gold demand much higher than the bearish bullion bank economists are expecting. Dubai is known as the “City of Gold”, and I’m predicting it ultimately dwarfs London, New York, Shanghai, and Singapore in gold trading volume.

  9. In the big picture, it’s only fitting that the world’s primary centre of gold price discovery should be in Dubai, the city of gold.

  10. Most bank economists have only a mildly negative outlook for gold in 2015. ANZ and TD bank are bullish, and focused on jewellery demand!

  11. Also, Bloomberg News quotes Barclays economists this morning with this statement, “The lows of this year and next are likely to offer attractive entry-level prices for the longer-term investor.” – Suki Cooper and Kevin Norrish, Barclays economists, January 12, 2015.

  12. As 2014 began, the gold bears at the banks sounded more like financial terrorists than economists, and many investors in the Western gold community became extremely frightened. Some even became bitter, regretting their involvement with gold stocks.

  13. The good news is that the tone of the gold bears has changed dramatically, in recent months. Also, their predictions of drastically lower prices based on the tapering of QE failed to materialize. I think their predictions this year of lower gold prices based on rate hikes will meet a similar fate.

  14. Please click here now. The Indian wedding season officially begins in just two days, on January 15, and that should add more support to the gold price.

  15. Please click here now. The Indian government is under tremendous pressure from hundreds of thousands of jewellers, to cut the import duties.

  16. It’s time to bring the world’s largest gold jewellery industry out of the control of the Indian mafia, and into Narendra Modi’s “Make in India” hands. I’m predicting that India will build Dubai-certified refineries over the next three years. They will sign huge supply contracts with many of the Western gold community’s favourite mining companies!

  17. There’s more good news for all gold stock enthusiasts. Please click here now. Lower oil prices that help lower the cost of mining should now bring serious attention to gold stocks, from many institutional investors.

  18. Regardless of whether gold ends the year a bit higher or a bit lower, I think gold stocks could have a stellar year.

  19. On that note, please click here now. That’s the GDX daily chart. The volume is bullish.

  20. Note the position of the 14,7,7 series Stochastics oscillator, at the bottom of the chart. It’s overbought, with the lead line at about 90.

  21. The most reliable price breakouts tend to occur with the daily chart oscillator in this type of overbought condition. I was looking for a two day consecutive close over $20.50 to bring significant hedge fund investment into GDX, and as of yesterday’s close, that’s now in play.

  22. Please click here now . That’s the GDX monthly chart. Even a bearish technician should be open to a rally towards the upper channel line in the $25 - $26 area.

  23. Please click here now. That’s the weekly GDXJ chart. Watch the $30 price zone carefully.

  24. A two day consecutive close about $30 should bring hedge funds into junior gold stocks, igniting a strong GDXJ rally to $45!

The Bull Market is Back – at Least in Non-USD Terms

The gold price most traders are focused on is the dollar price of gold – this is no wonder, as the COMEX is the most important price setting market for gold, and gold is internationally mainly traded in dollars. It is often useful to abandon this dollar-centric view, as for the rest of the world’s population gold’s trend in local currencies is obviously of greater importance.
Since gold is primarily a monetary asset, the main question for someone residing in a European or Asian country is whether the purchasing power of gold is increasing against the purchasing power of the domestic fiat currency. Interest rates (better: real interest rates) naturally play an important role in this, as their height determines the greatest portion of the opportunity cost of holding gold (the remainder is related to storage costs and where applicable, insurance costs).

This is not A final shot, needs Coasters from 616 To fill in right 2


As the chart further below shows, due to the recent combination of dollar and gold strength, gold has broken out, respectively entered an uptrend, in euro and yen terms over the past year. In dollar terms, a similar breakout over lateral resistance has yet to occur. However, experience shows that the gold price in foreign currency terms often leads the US dollar gold price, which is why it makes sense to keep an eye on such developments.
Even in USD terms a few higher lows have been put in recently and the 50 day moving average has turned up after declining for several months, so the technical picture has improved somewhat, if in fits and starts. It is still too early to rule out an eventual final washout to the “technical attractor”, which is the 2008 high near $1,040, but the probability of this happening in the near term has decreased significantly.
This is also suggested by the recent trend in gold’s “real price”, i.e., its trend relative to commodities. Gold has bottomed against commodities in April of 2014, and the new uptrend in this ratio has recently accelerated. This is important for two reasons: for one thing, it is a subtle sign of declining economic confidence, which is quite in contrast to the performance of the stock market, but seems to be confirmed by the action in treasury bonds. Secondly, an increase in the gold price relative to commodities usually indicates that the profit margins of gold mining companies are rising as well. The gold sector tends to exhibit a long term negative correlation with the stock market (even though the two can often trend in the same direction over shorter time horizons) precisely because the earnings of gold mining companies tend to rise just as the earnings of other companies are coming under pressure.

1-Gold in various currenciesGold in dollar, euro and yen terms. In dollar terms the recent uptrend still looks quite weak, but in terms of euro and yen it looks like a solid reversal has been put in place – click to enlarge.

2-Gold vs commodities
Gold relative to commodities: the “real price” of gold has been in an uptrend since April 2014, and this has recently been confirmed by a breakout in the ratio above a consolidation area that it has spent several months in. The most recent move higher was mainly a result of the decline in crude oil prices – click to enlarge.

Gold Stocks Closing in on Resistance

Last year we discussed the squall of panic selling in gold stocks in late October /early November more or less in real time in great detail (see: “An Anti-Bubble Blow-Off in the Gold Sector”). As we pointed out, the decline had all the hallmarks of a capitulation, and in hindsight it has turned that at least “a” low was indeed put in right then and there. This was followed by a retest in December – the time when retail tax loss selling in weak sectors is most pronounced. The early November low was established shortly after the bulk of institutional tax loss selling was done.
Since then, the gold sector has recovered somewhat, exhibiting relative strength versus gold in the process. It is now approaching a zone of resistance formed by the 2013 and early 2014 lows. Obviously, a move above this resistance zone would be a good sign, but it is probably going to involve some backing and filling, even if it does eventually happen.
We want to briefly comment on the fact that a number of gold stocks have recently received downgrades. To our mind these downgrades are probably a late cycle contrarian phenomenon, mainly because they make no sense at this juncture. We should rephrase that: they only make sense if one not only assumes that gold will resume its decline, but also that the decline will exceed the expansion in gold mining margins that has been underway in recent quarters and has noticeably accelerated in Q 4 2014.
Energy is a major input cost in gold mining (especially for open pit mines) and the cost of energy has just declined rather precipitously, concurrently with a recovery in the gold price. Other input costs are falling as well. The once tight labor situation in the mining sector has become a lot more relaxed due to the decline in gold and commodity prices since 2011. Demand for inputs like industrial tires, chemical reagents, timber, steel, etc. has decreased with the softening of the global economy and the prices for these items have come down as a result.
Let us just say that there have surely been better moments to downgrade gold stocks. The potentially most useful of these opportunities were not recognized at the time they presented themselves. On the contrary, we recall that in the weeks just prior to gold’s 2011 peak, numerous upgrades were dispensed.

3-HUIThe HUI Index and the HUI-gold ratio. The lateral support/resistance lines are derived from highs and lows further in the past – click to enlarge.

Conclusion:

Since gold has not broken above resistance in dollar terms yet and gold stocks still have to achieve a solid breakout as well, the signs that a medium/ long term bottom may be in are still tentative. However, the technical backdrop has clearly improved in light of gold entering an uptrend in major foreign currencies and against commodities. This is more or less in line with what happened at the beginning of the bull market in 2000-2001 (incidentally, the ratios of gold stocks to the broad stock market and various other market sectors have recently returned to the levels of 2000 and turned up from there).
The fundamental backdrop for gold is not unambiguously bullish yet – just as some indicators have turned more bullish, others have turned more bearish, leaving an overall neutral situation in place. So there is still a wide range of possible outcomes, but considering the capitulation-like declines seen late last year, it seems to us that short to medium term strength in the sector is more likely.
The Oil-Drenched Black Swan, Part 4: The Head-Fake Disruption Ahead  

Add these factors up and we conclude there is no visible price limit on oil after supply falters.

I've been discussing the concept of an Oil Head-Fake since 2008.
 

The basic idea is straightforward: as global demand slackens, oil producers are incapable of reducing supply due to their dependence on oil revenues. This leads to oversupply which further depresses prices, to the point that marginal wells are shut off and costly exploration-development projects are shelved.
This process is far from orderly, as the low prices destabilize oil-dependent governments and regions. Geopolitical turmoil is only half the story; the immense mountain of debt that's been built on the collateral of oil collapses as cash-starved borrowers default on bonds and loans. This meltdown of oil-based debt then destabilizes an increasingly fragile global financial system.
Supply can be turned off easily enough, but it can't be expanded as easily. Costly deepwater wells that were shelved in the price bust can be restarted, but it takes many years to bring these hyper-expensive projects online.
Meanwhile, existing production declines without constant injections of capital and expertise. Contrary to popular conception that oil flows for decades without having to do anything other than poke a hole in the ground, oil fields need huge investments of capital to maintain high production: carbon dioxide or water must be injected into the wells, and so on.
So even if fields are kept online through the price bust, their production will decline as capital spending dries up.

The end result of the price bust is impaired supply: impaired by depletion, impaired by reduced investment, impaired by the collapse of oil-based debt.
Even if demand only remains constant, the price of oil will rise as supply falls. And with several billion people aspiring to the energy-intensive middle-class lifestyle of the developed world, we can anticipate global demand rising even if it stagnates in the developed world.
The price drop is a head-fake: it doesn't usher in a new era of permanently cheap oil. Rather, it unleashes dynamics that impair supply on multiple levels: geophysical, geopolitical, demographic and financial.
When supply cannot be jacked up to meet demand, prices will rise. As I have noted before, demand is somewhat elastic in the developed world--business meetings can be done online, vacations can be postponed, car pools can reduce single-driver trips, and so on.
In the developing world, the entrepreneur who uses his motorcycle to earn his livelihood doesn't have an alternative; if the price of a liter of fuel doubles, he has no choice but to pay it.
In other words, as the number of people who depend on oil rises, the elasticity of demand declines accordingly. Higher prices may not reduce demand in the way conventional economic models expect.

The oil-exporting nations have introduced another disruptive dynamic: fuel subsidies for their domestic markets. These fuel subsidies are political bribes to the citizenry chafing under the poverty and powerlessness of life in oil-financed kleptocracies.
Simple supply and demand dictates the destabilizing result of these generous subsidies: the cheap fuel is squandered and demand soars. Many of the nations that heavily subsidize fuel are facing the evaporation of their oil exports as domestic demand absorbs more of their total production.
This dynamic will force kleptocracies into a double-bind: if they end the subsidies, they face destabilizing domestic unrest. If they continue the subsidies, they lose their oil exports and income needed to service their debt, fund their welfare states and armed forces.
Either way, the kleptocracies implode, and in the resulting turmoil capital investment in their oil production will plummet, further reducing supply.
Add these factors up and we conclude there is no visible price limit on oil after supply falters. If I need two liters of petrol to make money for food today, I will pay whatever it takes. $200/barrel oil is no impediment because I need those few liters to earn my livelihood.

The Hidden Perils of Low Interest Rates

John Browne


Late last year, with the U.S. economy experiencing falling unemployment and seemingly low inflation, observers were extremely confident that the Federal Reserve would move judiciously in 2015 to restore 'normal' interest rates sooner rather than later. However, in light of the recent fall in both stocks and oil, that conviction has softened considerably.
Many, such as the very influential Bill Gross, now believe that our current Zero Interest Rate Policy (ZIRP), which has been in place for six years, will remain in place throughout the year. While this likelihood is a disappointment to many, who would have preferred to see the economy move along without Fed-supplied training wheels, few really understand the pernicious effects these policies are inflicting on the economy the longer they are held in place. In short, ZIRP is slowly transforming the world economy into a dysfunctional basket case.
Historically, it has been estimated that a 'normal' fair rate of return on short to medium-term high quality debt is between 2 and 2.5 percent, net of inflation. Recently, the Fed published year-on-year U.S. CPI inflation for mid November 2014 at 1.3 percent. This would suggest normal short-term rates are at around 3.5 percent at present.
However, using the government's methodology that was in place prior to 1990, John Williams' Shadow Government Statistics (SGS) newsletter calculates inflation to be currently some 5 percent. Using methods in place prior to 1980, it is a staggering 9 percent. At that level, current interest rates should be somewhere around 11.0%. Even if we estimate that real inflation is currently 3%, then our "normal" rate of interest should be around 5%. This is some 50 times the rate paid currently on most bank deposits. This gap is distorting the economy in untold ways.
In early December 2014, the U.S. Congress approved further Government spending of some $1.1 trillion. This came just as the U.S. Treasury's debt broke through a total of $18 trillion. It wasn't that many months ago that the $17 trillion barrier was first breached.
Currently, the U.S. Treasury can borrow for 10 years at around a rate of 2 percent. But if long term rates rose to 5 percent, which would be in line with the historic range of "normal," the 3 percent difference would cost the Treasury an additional $540 billion in annual interest payments (based on the current $18 trillion in debt). This would considerably undermine the government's fiscal position, and necessitate an upheaval in federal budgeting.
The financial repercussions of a tripling or quadrupling of interest rates truly are horrific. They lead to a sense of foreboding that the Fed, aware acutely that the U.S. Treasury simply cannot afford a return to normal interest rates, will not restore normal rates unless forced to do so by international bond or currency markets. It appears, therefore, likely that ZIRP will continue for years to come. This feeling is underpinned by a view that low interest rates are simply a benign stimulant that fails to appreciate the actual harm they impose, particularly in the fixed income markets.
Savings are the prime source of real long-term investment. Today, savers are being crushed by the Fed's manipulation of interest rates to below a real return. To find even small real returns, investors have had to scour the financial landscape for sources of yield. In doing so, they have ventured into risky territory and have, for instance, flooded into the high yield market, pushing junk yields to record low territory. The repercussions of providing excess capital to risky businesses have yet to be experienced, but the energy industry should provide us with a hint of things to come. Over the last few years small and midsized energy firms were able to borrow cheaply and lavishly to fund drilling projects, thereby greatly increasing production. But in retrospect, these efforts look like they helped create an oversupply of energy that has depressed the price of crude and has exposed the energy sector to long-term financial stress. Bankruptcies and creditor losses may be inevitable.
Another concern of the Fed is that despite an unprecedented increase in liquidity and part-time employment, real job creation is still sluggish at best. Furthermore, the Manhattan Institute's Power & Growth Initiative Report of February 2014 notes that the U.S. oil and gas boom has created some one million jobs with a further ten million in associated occupations. The oil boom has improved net employment and kept the economy out of recession. But oil prices have fallen dramatically, threatening these economic bonuses and high-yield bond defaults. It's hard to see what other distortions and hidden pitfalls have been created by negative real rates. The traps often become visible only after they have been sprung.
But with major economies such as the European Union, Japan and Russia flirting with recession (and China slowing down considerably), there is growing fear that normal interest rates would be dangerous at present. This fear likely will encourage the maintenance of ZIRP, possibly for years, with financial markets disconnected increasingly from the real economy.
Therefore, investors may continue to benefit for some time from the consistent boosting of financial markets by central banks. However, the longer a major correction or even a crash takes to develop, the more sudden, deep and devastating it may be.