
This is featured post 2 title
Replace these every slider sentences with your featured post descriptions.Go to Blogger edit html and find these sentences.Now replace these with your own descriptions.This theme is Bloggerized by Lasantha - Premiumbloggertemplates.com.

This is featured post 3 title
Replace these every slider sentences with your featured post descriptions.Go to Blogger edit html and find these sentences.Now replace these with your own descriptions.This theme is Bloggerized by Lasantha - Premiumbloggertemplates.com.


Sunday, 9 November 2014
 22:56
22:56
 Unknown
Sprott's Thoughts
Capitulation or Nasty Sell-off in Gold?
Have we just experienced ‘capitulation’ in gold stocks, or just a particularly nasty sell-off?
Rick often mentions that ‘capitulation’ is a looming threat in a bear market. When it looks like stocks are already ‘down and out’, investors get driven over the edge and decide to sell at any price they can get. Investors want out. People who work in mineral exploration and development also give up and look at other career options.
Back in March, Rick said gold could fall back to around $1,150 this year. In mid-October, Rickmade a stronger prediction – October could be the month that we see capitulation in the junior market. “October is a month full of emotion” he said, and it’s easy for a weak emotional market to be driven over the edge by short-term volatility and a natural decline in prices due to tax-loss selling. “The market is cheap but it will get dirt cheap in a capitulation. I think there is a 50 percent chance for a terrifying capitulation sell-off within the next two weeks.”
In a complete capitulation, stocks melt down dramatically and some stocks just go ‘no bid.’ That hasn’t happened yet, which means that we may be witnessing a very nasty sell-off, but not complete capitulation.
“For those of you fond of surf,” Rick explained at our San Diego office, “capitulation is sort of like getting caught under a particularly big wave. You get pummeled and tumbled around under water. Capitulation in 2000 only lasted for about two weeks. Just like when you’re stuck underwater and struggling to come back up, a short amount of time can seem like an eternity.”
The most important thing to do now? Prepare yourself psychologically.
“Abandon your ‘hope stocks’ – the ones where there is no catalyst, asset, or enough cash to do anything important. Get rid of the stocks you own that have no reason to go up, and get into ones that do,” Rick advises. In a complete sell-off, you may find that just a few investors will make the difference as to whether a particular stock survives, which means you must be willing to be one of those investors if the market gets much worse.
This ‘psychological preparation’ made all the difference in the summer of 2000, the last time that we saw capitulation in junior mining stocks. “The capitulation in 2000 was the single most beneficial event of my career, as a consequence of my psychological preparation to face the sell-off,” said Rick.
Capitulation or not, why the sudden leg down?
“It’s an emotional market. An example of irrational behavior is that investors are more willing than ever to put money into bonds at levels that guarantee a loss in purchasing power. The Treasury rate is now lower than prior lows, at around 3.1 percent for 30-year bonds.1
“In addition, benchmarks in platinum and other metals suggest a weakening economic outlook,” Rick explained. This, he says, is also the real reason that oil prices are much lower. The economy is simply a lot weaker in the US and globally than commonly believed. This has weakened all equities, not just precious metals. Just as the 2000 low came around the time that the tech boom imploded, a capitulation today could coincide with a sell-off in stocks across the board.
Rick’s market call, which was recorded for our clients on October 16th, looks prescient in hindsight. We’ve indeed seen a nasty sell-off, but I don’t think it’s quite a capitulation.
For one thing, Rick explained, when a capitulation occurs, the issuers also ‘give up.’ Right now, we’re still in a game of chicken that we’ve been playing with junior miners for the last two years or so. They believe they can wait out the bear market to raise money. If they’re right, they might not have to submit to terms that Rick would call ‘fair.’ If they’re wrong, they’ll end up having to raise cash at terms that are much more favorable to financiers like Rick.
The idea now is to prepare for this possibility, and decide which stocks we own are worth saving if the market truly goes ‘no bid,’ as we might have to put up more capital to keep them solvent. The rest we probably shouldn’t own at any price.
P.S.: Not yet subscribed to Sprott’s Thoughts? Sign up here to stay informed with the latest opinions on precious metals and natural resources.
22:55
Unknown
Gold Bug Psychology Must be Neutered
While Biiwii.com will remain active and even increase many of its functions, the more technical of its former topics will now take place at the new NFTRH.com. Check it out and don't forget to bookmark/follow!
The precious metals bear market, beginning with silver’s blow out in early 2011 and the general top in the commodity and ‘inflation trade’ along with gold’s lesser blow out later that summer amidst Euro crisis hysterics, has been all about psychology. Well, every bear or bull market is about psychology, but the intensity of this dynamic has been something to behold in the gold sector over these last few years.
Psych 101
In early 2011 long-term interest rates were rising in response to inflationary pressures, ‘Bond King’ Bill Gross famously shorted the long bond, virtual mobs with pitchforks were storming the Fed’s castle calling for Ben Bernanke’s head and silver went to $50 an ounce, with calls for $100, $200, etc. All psychology my friends.
While on the subject of the long bond, our ‘Continuum’ chart shows that players did not learn 2011’s contrarian lesson with respect to yields as they took Wall Street’s ‘Great Rotation’ hype hook, line and sinker in 2013. What did the 30 year yield then do? Why, it hit our long-term limiter (monthly EMA 100, red dotted line) and has dropped ever since.

Pigs on the Wing & Sheep
If market participants are “Sheeple” as many gold bugs believe, then the average gold bug – as evidenced by so many peoples’ staunch refusal to give up on the shiny relic – are Sheeple squared, because the gold “community” (right there a give away on group think) has distinct leaders or troubadours who, if the faithful will just hang in there long enough, will be proven right as we are all led to the promised land.
Yet the bear market has cruelly put the promised land further and further out on the horizon with each impulse of hope. The gold story is one of righteousness because sound value (and insurance) not beholden to leverage is monetarily righteous. But promoters and/or buffoonish spokespeople have either knowingly or unknowingly used the righteousness of the message to keep people firmly in the grip of dogma all the way down during the bear market.
To make matters worse the ‘pigs’, led by Goldman, JPM and Wall Street in general, have feasted and feasted some more on the propped up paper entity built on what will one day be ‘discovered’ to have been disastrously insane policy making. That is a double whammy for a gold bug who stands for what is right.
A Reality
But these are the markets. You sit at your computer and I sit at mine. We press buttons and make digital transactions in a system that is functioning just fine for now. Within this, psychology is clustered toward speculation and risk taking and against a risk ‘OFF’ environment. This is the reality.
So I would say to gold bugs that what you must do is “put your dogma on a leash” [1], manage risk against your world view and be ready for a) a return to sanity as the system is compelled by the next bear market to reform its ways and b) potentially a grand opportunity to speculate in the diggers of gold out of the ground.
Current Situation
So where are we at? Well, I have a couple pet market writers (un-named and shall remain so) on whom I depend for contrary signals. One just went hyper bearish (with HUI now at the 2008 lows) indicating the potential for a bounce. The other is still sounding 100% right even as he has been bullish all the way down. The fact that he is still apparently tugging at gold bugs’ greed impulse is a negative and implies further downside pending any bounce activity that may crop up.
In NFTRH we have been managing what we called the 2008 ‘Fear Gap’ for years now. Once gold made its first major support breakdown, we looked at the potential for the entire sordid mess we used to call “Armageddon ’08” to be closed out with a fill of the upside gap in gold vs. the US stock market. Well… consider it closing if not closed.

I believe that those who will be bullish on gold and the gold miners from the depths of this bear market are going to well rewarded in both their holdings in real monetary value (gold) in a world gone berserk and in their speculations associated with that value (gold stocks of relative quality). But first you must be intact and that means guarding against your own bias, dogmatic beliefs and even certain truths as you know them.
These are the financial markets after all. Be guarded when appropriate and be brave when appropriate. NFTRH has spent all too many years now guarding against bias reinforcement and simply dealing with what look like insane realities. It was too easy to listen to the promoters for many people. That was the easy way out, to have their perceptions reinforced.
We are not out of the woods, and on coming bounces these promoters will be right back at it. When they are neutered or more accurately, when the gold bug community’s actionable perceptions of them are neutered, the sector will resume its bullish place in a global financial market that is ripe for change where today’s pigs will become tomorrow’s bewildered sheep and today’s bewildered sheep… well, you know.
[1] Quoted from a song by long-ago Boston rock band Volcano Suns.
22:52
Unknown
Gold, Inflation Expectations and Economic Confidence
Steve SavillePosted Nov 9, 2014
Below is an excerpt from a commentary originally posted atwww.speculative-investor.com on 2nd November 2014. Also, excerpts from our newsletters and other comments on the markets can be read at our blog.
As a result of what happened during just one of the past twenty decades (the 1970s), most people now believe that a large rise in "price inflation" or inflation expectations is needed to bring about a major rally in the gold price. This impression of gold is so ingrained that it has persisted even though the US$ gold price managed to rise by 560% during 2001-2011 in parallel with only small increases in "price inflation" (based on the CPI) and inflation expectations. The reality is that gold tends to perform very well during periods of declining confidence in the financial system, the economy and/or the official money, regardless of whether the decline in confidence is based on expectations of higher "inflation" or something else entirely.
Inflation expectations are certainly part of the gold story, but only to the extent that they affect the real interest rate. For example, a 2% rise in inflation expectations would only result in a more bullish backdrop for gold if it were accompanied by a rise of less than 2% in the nominal interest rate. For another example, a 1% decline in inflation expectations would not result in a more bearish backdrop for gold if it were accompanied by a decline of more than 1% in the nominal interest rate.
Other parts of the gold story include indicators of economic confidence and financial-market liquidity, such as credit spreads and the yield curve.
The large rises in the gold price are NOT primarily driven by increasing fear of "inflation" is evidenced by the fact that the large multi-year gold rallies of 2001-2006 and 2008-2011 began amidst FALLING inflation expectations. These rallies were set in motion by substantial stock market declines and plummeting confidence in central banks, commercial banks and the economy's prospects. Even during the 1970s, the period when the gold price famously rocketed upward in parallel with increasing fear of "inflation", the gold rally was mostly about declining real interest rates and declining confidence in both monetary and fiscal governance. After all, if the official plan to address a "price inflation" problem involves fixing prices and distributing "Whip Inflation Now" buttons, and at the same time the central bank and the government are experimenting with Keynesian demand-boosting strategies, then there's only one way for economic confidence to go, and that's down.
Since mid-2013 there have been a few multi-month periods when it appeared as if economic confidence was turning down, but on each occasion the downturn wasn't sustained. This is due in no small part to the seemingly unstoppable advance in the stock market. In the minds of many people the stock market and the economy are linked, with a rising stock market supposedly being a sign of future economic strength. This line of thinking is misguided, but regardless of whether it is right or wrong the perception is having a substantial effect on the gold market.
For now, the economic confidence engendered to a large extent by the rising stock market is putting irresistible downward pressure on the gold price.
Friday, 7 November 2014
20:16
Unknown
European, Chinese Economic Data May Underscore Divergence From US, Could Weigh On Gold |
(Kitco News) - Next week brings more attention to eurozone and Chinese economic data, and the results may serve to underscore the monetary policy divergence between the U.S. and the rest of the world.
That could result in the U.S. dollar gaining further and putting pressure on gold, which could reverse some of the gains the yellow metal enjoyed Friday.
December gold futures rose Friday, settling at $1,169.80 an ounce on the Comex division of the New York Mercantile Exchange, down 0.09% on the week. December silver rose Friday, settling at $15.714 an ounce, down 2.28% on the week.
Participants in the Kitco News Gold survey remain bearish. Out of 36 participants, 23 responded this week. Of those, six see higher prices, 14 see lower prices and three see prices trading sideways or are neutral.
Gold prices rallied off the four-and-one-half-year lows set overnight Friday around $1,130. Analysts said the combination of short covering after the U.S. nonfarm payrolls report, a weaker U.S. dollar and news of stepped-up military action in Ukraine pushed gold above technical-chart resistance around $1,160.
The U.S. Labor Department said Friday the U.S. economy created 214,000 jobs in October, with the unemployment rate lowered by 0.1 basis point to 5.8%. That figure was under the 230,000 jobs expected. Employment gains for September and August were revised up by a combined 31,000.
“Overall it was an OK jobs report. I don’t think it changes overall our positive outlook for the U.S. economy,” said Rob Haworth senior investment strategist, U.S. Bank Wealth Management.
What it does is give the Federal Reserve some room before it needs to raise interest rates, particularly since wage growth remains low, he said. “At this point the chance of a rate hike in March is low,” Haworth said.
The economic calendar in the U.S. will be light next week, so traders’ focus will be on data expected out of Europe and Asia, analysts said. And the reports will likely to reinforce the sluggishness seen in Europe and China.
Robin Bhar, head of metals research at Societe Generale, said if the economic data from Europe and China come in weak, they will underscore the prevailing view of the differences between the U.S. and those regions and support the dollar.
In Europe, several countries will release their first third-quarter gross domestic product data, and China will release reports on industrial production growth, producer price index and export data.
“The data in the U.S., including the jobs report, and (European Central Bank President Mario) Draghi being very dovish (on monetary policy) means the dollar continues to be bid up. That’s going to keep the pressure on gold,” Bhar said.
“Next week there will be more views on policy divergence with the Fed (Federal Reserve) needing to eventually tighten rates, and Japan, the eurozone and even China showing their economies are growing much slower and (they) need easy monetary policies,” he said.
Haworth agreed.
“Policy divergence is well entrenched at this point,” he said. “I’ll be most interested in China’s data. We’re focused on what is the real tenor of growth in China at this point. We expect it to not be 7.5% or 8% as it has been in past, but will it be under 7%? That has some ramification on big trading economies like Europe,” he said.
Related Stories:
- Passage Of Swiss Referendum Would Support Gold, But Other Central Bank Actions Could Offset It –TDS
- IBA Named Third-Party Administrator For LBMA Gold Price Mechanism
- Financial Markets Need Stronger Security Against Cyber Attacks – CFTC's Massad
Gold put in a solid rally on Friday, pushing through some initial technical-chart resistance points around $1,160. However, several gold-market watchers said the gains may be more of a selling opportunity than the start of a further move higher.
“I can’t get too excited about it. The best thing you can say is it produced an outside day up,” said Charlie Nedoss, senior market strategist at LaSalle Futures Group.
An outside day on a technical chart occurs when the current day’s prices exceed the high and the low of the previous day.
Nedoss said because gold prices fell so far, so fast, they remain under major moving averages. He said the 10-day moving average sits around $1,184.
“Until we get above there, I think people will use the rally as an opportunity to sell. The dollar is so strong, especially compared to the rest of the world,” Nedoss said.
Haworth said traders who were short gold this week likely sought to book profits. He also does not expect Friday’s gains will hold in the medium term.
“For us, as we look over the next couple of months, the dollar trend is still stronger, the U.S. economic trend is positive, the Fed ended QE (quantitative easing) and may raise rates, and geopolitical risk is not a major factor going into the year end. We’re not looking for any support until gold gets under $1,100,” he said.
20:11
Unknown
Close to the Bottom but Not There Yet
The selloff in precious metals intensified over the past week. GDXJ declined 25% in seven days while Gold plunged below $1180 to $1140 and Silver plunged below $16 and to as low as $15.20. Precious metals are becoming extremely oversold and the bear market is clearly in the 9th inning. Be on alert for a snapback rally to repair the extreme oversold conditions. Although we are likely very close to the bottom in the miners, Gold’s current position continues to leave me skeptical.
Below is the updated bear analog for Gold which uses weekly data. Gold has yet to suffer the extreme selling experienced by Silver and the mining stocks. It makes sense given that Gold peaked months after those assets. The chart illustrates how bear markets are a function of price and time. The most severe bears in price are the shortest in time while the longest bears in terms of time are the least severe in terms of price. This bear falls in between. Given that Gold went 10 years without a real bear market it makes sense that this bear could bottom very close to the 1983-1985 and 1975-1976 bears but will have lasted quite a bit longer.
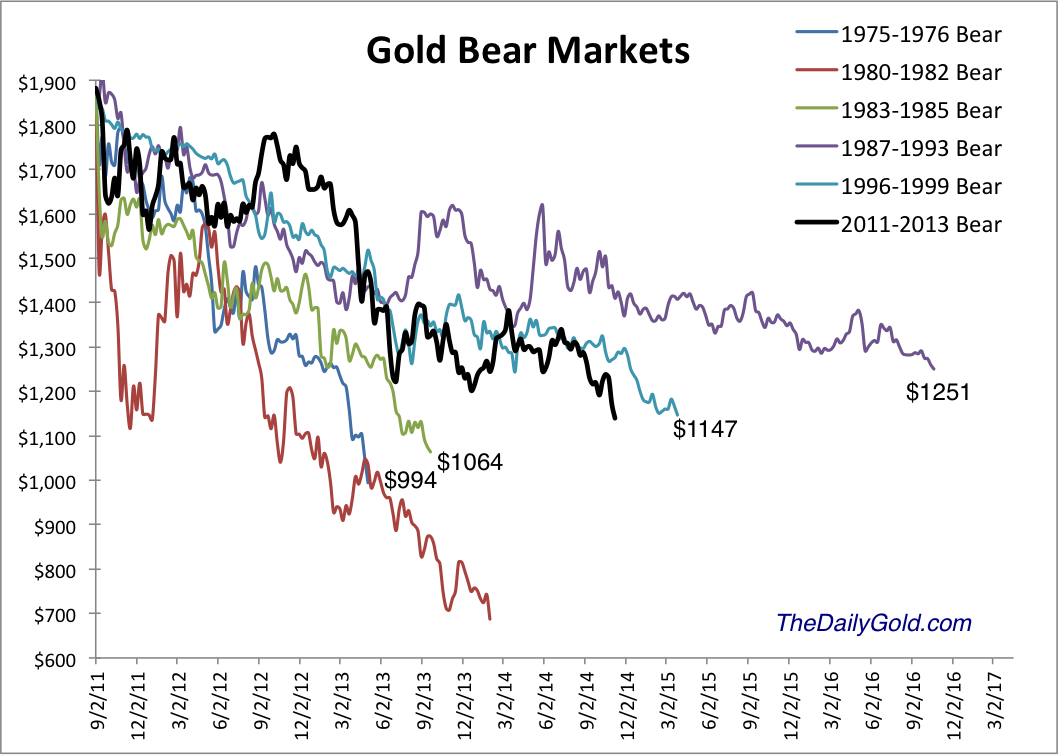
With respect to Gold, another point to consider is the strong supports at $1080/oz (50% retracement of the bull market) as well as $1000/oz. These downside targets continue to align well with the history depicted in the bear analog chart. Moreover, the fact that Gold currently sits well above these support levels is reason to expect more downside.
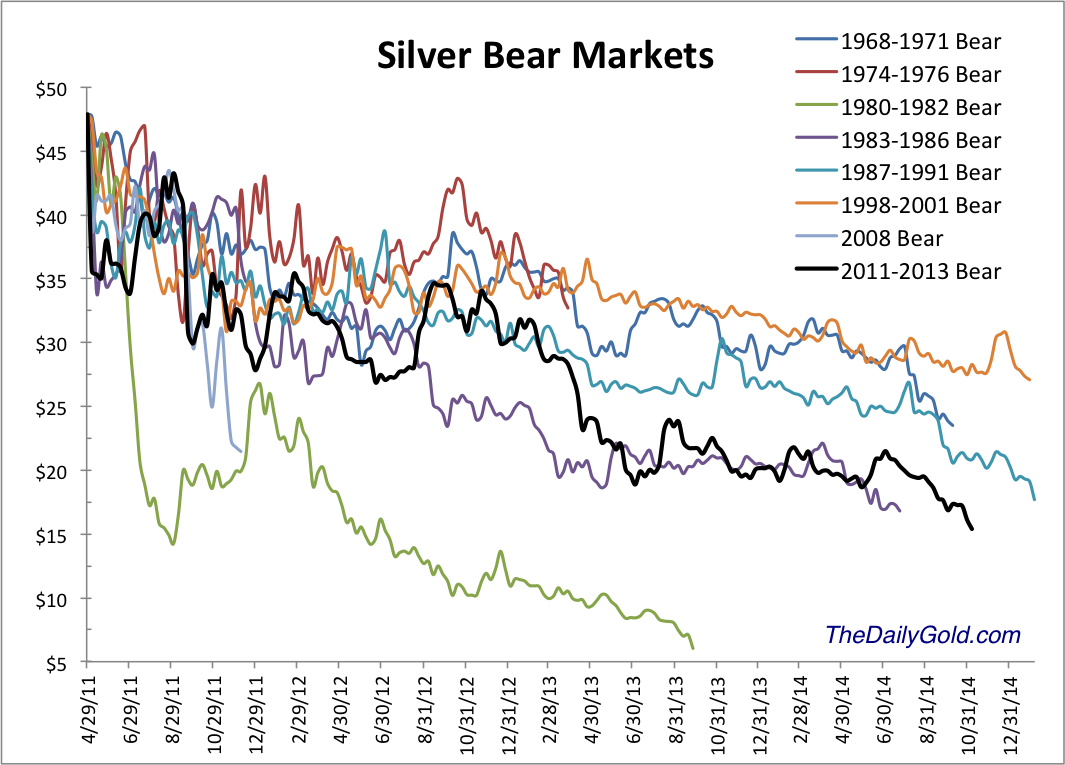
Silver on the other hand figures not to have the same degree of downside. Silver’s bear began five months before Gold’s and the bear analog below makes a strong case that the current bear will end very soon. Other than the epic collapse from 1980-1982, the current bear is the worst ever for Silver in terms of price and is the third worst in terms of time.
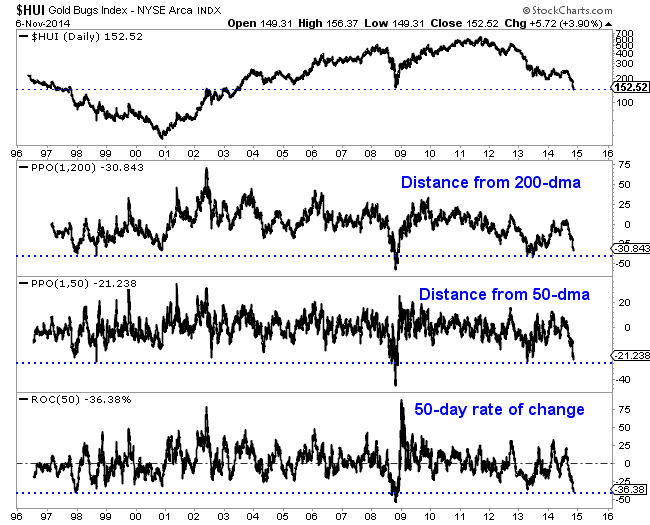
Similar to Silver, the mining stocks which led the bear market are moving from very oversold to extremely oversold. The HUI Gold Bugs Index, shown below closed Wednesday at an 11-year low. As far as the HUI’s distance from its 50 and 200-day moving averages, it is inches from major extremes. Over the past 50 days the HUI has declined 36.4%. That is the second worst performance over the past 20 years. The picture is even worse for the junior mining sector. GDXJ has declined 43% over the past 50 days. It is trading at the lowest level relative to its 50-day moving average since the creation of the ETF.
The worst bear market ever for the gold stocks was the more than four and a half year decline following the junior bubble in 1996. That bear did have a 14 month long respite where the indices rallied as much as much as 70% and 80%. That rally was longer and much larger than the one experienced recently. During the 1996-2000 bear, the GDM index (forerunner to GDX) declined 77.5%. Through Wednesday it was down 76%. The XAU declined 72.5%. Through Wednesday the XAU was off 74.2%. The Barron’s Gold Mining Index declined 75% during the late 1990s bear. Through last week it was down 68%.
The mining stocks and Silver are obviously extremely oversold and very close to the bottom. It could happen any day or any week. However, I’m skeptical because Gold is currently trading so far above its potential bottom. Sure, Gold figures to be the last to bottom but my view is the window for a bottom in the stocks could come when Gold declines below $1080. That being said, we could definitely see a snapback rally of some sort. The mining stocks and Silver are extremely oversold and could pop higher in the short-term.
In any event, the bear market is very close to its end. The weeks and months ahead figure to be very enticing and exciting for precious metals traders and investors. Expect quite a bit of volatilty as we see some forced liquidation from longtime bulls and as the sector tries to carve out a major bottom. Opportunities are fast approaching so pay attention. Be patient but be disciplined. As winter beckons, we could be looking at a lifetime buying opportunity. I am working hard to prepare subscribers. Consider learning more about our premium service including a report on our top 5 stocks to buy at the coming bottom.
20:02
Unknown
Dan Popescu Gold & Silver Analyst / Member of the Goldbroker.com Editorial Team
Mr. Popescu is an independent investment analyst and studies the gold and silver market and their future role in the international monetary system. He has followed regularly since 1970 the gold, silver and foreign exchange markets. He has a bachelor degree in physics (1993) from Concordia University in Montreal, Canada and has completed the Canadian investment management certificate (1999) of the CSI. He is a member and was the president in 2004 of the CSTA and also was president in 2005 of the Montreal CFA Society. He is a member of the CFA Institute, the MTA, NYSSA, UKSIP, the CSTA and the Gold Standard Institute International.
Let me look, in this article, at the anti-gold, the US dollar. All of a sudden, with the illusion of the end of QE, there is a strong belief that things have changed for the best for the U.S. and, more specifically, for the US dollar. All of a sudden, the US debt is gone and the deficit problem is almost solved with shale oil.
I have to admit that momentum has, all of a sudden, changed in favor of the US dollar. From a geopolitical point of view, I think the downing of the Indonesian airliner in Ukraine changed drastically, at least in the short term, the momentum in favor of the U.S. Before the incident, Europe was getting closer to Russia as the spying and other blunders by the American administration brought European leaders closer to it. All that changed after the Indonesian airliner incident in Ukraine. It was an unexpected gift to the U.S. and a major setback to Vladimir Putin’s strategy to split Europe from the U.S. However, president Putin has restrained himself in his comments to antagonize European leaders focusing his attacks on the U.S. and continuing negotiations with Europe. It is evident that he is looking for a split in the NATO alliance. Don’t count Russia and Vladimir Putin out yet, and China seems to be closer to Russia than to the U.S.
Is this the beginning of a new secular bull market in the US dollar? Some see a resemblance to the bull market started in 1980 when Ronald Reagan and the Republicans were voted in. I remember the mood in the U.S. in the last years of the Carter administration. Many of my American friends were extremely bearish on America. I remember speaking with an American couple in Montreal at the 737 Restaurant, on top of the Place Ville-Marie building, from where you can almost see the U.S. border. They were so depressed and disillusioned with their country. Americans were running away from the United States like rats from a sinking ship. It was for me a very contrarian bullish signal on the U.S., but I could not convince my American friends. We know what happened afterward. Can this be a repeat of that cycle? Some think so. I don’t. There was an illusion then that the U.S. would deal with the debt and deficit but we found out fast that the only thing changed was the type of waste. Rather than spend on civilian bureaucracy waste, Ronal Reagan and the Republicans chose military bureaucracy waste. The result was the same. The extra time gained to solve the debt/deficit problem was wasted and the U.S. finds itself today in a much worse position than in 1980.
Look carefully at this major triangle formation in the chart below. You can easily observe lower lows at each bottom and lower highs at each top. I expect this trend to continue.
Chart #1: US Dollar Index

Besides, what we are witnessing now is a collapse of the fiat (paper) monetary system that has started 100 years ago, not just in 1971 with the end of the Bretton Woods gold exchange standard. Looking at a short-term chart of a seasonal storm and ignoring the possibility of a tsunami that happens every one hundred years or more is a big mistake. The US dollar is facing a tsunami, not a seasonal storm. The dismantling of the petrodollar is in progress and both China and Russia are advancing slowly but surely to replace the dollar as much as possible in international trade. A picture of only 40 years gives an incomplete and distorted image.
Two major events in the immediate future promise to shake the US dollar, gold and the international monetary system: One is theSwiss referendum on gold reserves, but only if it is a YES vote, and the other one is an announcement by China of their actual gold reserves. The last time they did it, it was in 2009. I think the announcement is linked to the inclusion of the Yuan in the IMF’s basket of currencies called the SDR. I do not expect an announcement this year, but next year is a very strong possibility. I would not be surprised if, immediately after, Saudi Arabia also announces, as they did in 2009, an increase in their gold reserves.
Chart #2: Inverse US Dollar Index vs Gold since 1971

In addition, I have to caution you that since the euro introduction in 2001, the US dollar index has lost its significance, since it has become highly dominated by the euro. As you can see in the chart below, the euro represents now 57.6% and if we add the other closely related European currencies like the Swiss franc and the British pound, we get 77.3%.
Chart #3: US Dollar Index Components

This is confirmed by observing, in the chart below, the almost perfect correlation between the US dollar index and the euro/US dollar exchange since 2002.
Chart #4: Euro vs Gold vs Inverse US Dollar Index

A better image would be to look at the US Dollar Trade Weighted Broad Index. It includes major US trade partners and, especially, the BRIC countries. The Broad Currency Index includes the Euro Area, Canada, Japan, Mexico, China, the United Kingdom, Taiwan, Korea, Singapore, Hong Kong, Malaysia, Brazil, Switzerland, Thailand, Philippines, Australia, Indonesia, India, Israel, Saudi Arabia, Russia, Sweden, Argentina, Venezuela, Chile and Colombia.
Chart #5: Trade Weighted US Dollar Broad Index

I think the recent US dollar bull market is a short move and that dollar bulls will have a very rude awakening. There is also euphoria about the U.S. stock market that has been pumped up by the Fed through QEs. It looks as we are seeing the formation of a top in the stock market and it will coincide with a collapse of the dollar and a quantum leap in gold. I hear statements in the financial industry that I used to hear just before the collapse of the 2000 stock market bubble. Then it was a “new economy” and the end of cycles and today it is that the Fed will not let the stock market fall.
There is also a belief that gold and the euro/dollar exchange have to move together. This is wrong. In recent years, gold has increased with respect to all fiat currencies or more correctly, I should say has maintained its value while fiat currencies have been devalued competing to arrive first to their target, zero. It is possible to have the US dollar appreciate against the euro while at the same time fall against gold. The U.S. has also made it clear it does not want to see a stronger dollar and will intervene in the foreign exchange markets to ensure that. However, at the same time, the ECB has made it clear it wants a weaker euro. As you can see, currency wars are alive and I expect them to grow, irrespective of the G20 agreement not to follow such policies.The currency wars will end badly with the collapse of the US dollar-based international monetary system and gold taking front stage in any new system.
Gold will not move this time as it did between 2000 and 2009, slowly and progressively, but with a quantum leap. When all the petrodollars have no oil to buy, they will come home to roost, and all at once.
Short term, however, the US dollar still has the bullish momentum and gold the negative one, but don’t be blinded by the short term. Gold is closer to a bottom and the dollar is closer to a top.
19:58
Unknown
Sprott's Thoughts
Thursday, November 6, 2014
Capitulation or Nasty Sell-off in Gold?
Have we just experienced ‘capitulation’ in gold stocks, or just a particularly nasty sell-off?
Rick often mentions that ‘capitulation’ is a looming threat in a bear market. When it looks like stocks are already ‘down and out’, investors get driven over the edge and decide to sell at any price they can get. Investors want out. People who work in mineral exploration and development also give up and look at other career options.
Back in March, Rick said gold could fall back to around $1,150 this year. In mid-October, Rickmade a stronger prediction – October could be the month that we see capitulation in the junior market. “October is a month full of emotion” he said, and it’s easy for a weak emotional market to be driven over the edge by short-term volatility and a natural decline in prices due to tax-loss selling. “The market is cheap but it will get dirt cheap in a capitulation. I think there is a 50 percent chance for a terrifying capitulation sell-off within the next two weeks.”
In a complete capitulation, stocks melt down dramatically and some stocks just go ‘no bid.’ That hasn’t happened yet, which means that we may be witnessing a very nasty sell-off, but not complete capitulation.
“For those of you fond of surf,” Rick explained at our San Diego office, “capitulation is sort of like getting caught under a particularly big wave. You get pummeled and tumbled around under water. Capitulation in 2000 only lasted for about two weeks. Just like when you’re stuck underwater and struggling to come back up, a short amount of time can seem like an eternity.”
The most important thing to do now? Prepare yourself psychologically.
“Abandon your ‘hope stocks’ – the ones where there is no catalyst, asset, or enough cash to do anything important. Get rid of the stocks you own that have no reason to go up, and get into ones that do,” Rick advises. In a complete sell-off, you may find that just a few investors will make the difference as to whether a particular stock survives, which means you must be willing to be one of those investors if the market gets much worse.
This ‘psychological preparation’ made all the difference in the summer of 2000, the last time that we saw capitulation in junior mining stocks. “The capitulation in 2000 was the single most beneficial event of my career, as a consequence of my psychological preparation to face the sell-off,” said Rick.
Capitulation or not, why the sudden leg down?
“It’s an emotional market. An example of irrational behavior is that investors are more willing than ever to put money into bonds at levels that guarantee a loss in purchasing power. The Treasury rate is now lower than prior lows, at around 3.1 percent for 30-year bonds.1
“In addition, benchmarks in platinum and other metals suggest a weakening economic outlook,” Rick explained. This, he says, is also the real reason that oil prices are much lower. The economy is simply a lot weaker in the US and globally than commonly believed. This has weakened all equities, not just precious metals. Just as the 2000 low came around the time that the tech boom imploded, a capitulation today could coincide with a sell-off in stocks across the board.
Rick’s market call, which was recorded for our clients on October 16th, looks prescient in hindsight. We’ve indeed seen a nasty sell-off, but I don’t think it’s quite a capitulation.
For one thing, Rick explained, when a capitulation occurs, the issuers also ‘give up.’ Right now, we’re still in a game of chicken that we’ve been playing with junior miners for the last two years or so. They believe they can wait out the bear market to raise money. If they’re right, they might not have to submit to terms that Rick would call ‘fair.’ If they’re wrong, they’ll end up having to raise cash at terms that are much more favorable to financiers like Rick.
The idea now is to prepare for this possibility, and decide which stocks we own are worth saving if the market truly goes ‘no bid,’ as we might have to put up more capital to keep them solvent. The rest we probably shouldn’t own at any price.
P.S.: Not yet subscribed to Sprott’s Thoughts? Sign up here to stay informed with the latest opinions on precious metals and natural resources.
1 U.S. Department of the Treasury website
This information is for information purposes only and is not intended to be an offer or solicitation for the sale of any financial product or service or a recommendation or determination by Sprott Global Resource Investments Ltd. that any investment strategy is suitable for a specific investor. Investors should seek financial advice regarding the suitability of any investment strategy based on the objectives of the investor, financial situation, investment horizon, and their particular needs. This information is not intended to provide financial, tax, legal, accounting or other professional advice since such advice always requires consideration of individual circumstances. The products discussed herein are not insured by the FDIC or any other governmental agency, are subject to risks, including a possible loss of the principal amount invested.
Generally, natural resources investments are more volatile on a daily basis and have higher headline risk than other sectors as they tend to be more sensitive to economic data, political and regulatory events as well as underlying commodity prices. Natural resource investments are influenced by the price of underlying commodities like oil, gas, metals, coal, etc.; several of which trade on various exchanges and have price fluctuations based on short-term dynamics partly driven by demand/supply and nowadays also by investment flows. Natural resource investments tend to react more sensitively to global events and economic data than other sectors, whether it is a natural disaster like an earthquake, political upheaval in the Middle East or release of employment data in the U.S. Low priced securities can be very risky and may result in the loss of part or all of your investment. Because of significant volatility, large dealer spreads and very limited market liquidity, typically you will not be able to sell a low priced security immediately back to the dealer at the same price it sold the stock to you. In some cases, the stock may fall quickly in value. Investing in foreign markets may entail greater risks than those normally associated with domestic markets, such as political, currency, economic and market risks. You should carefully consider whether trading in low priced and international securities is suitable for you in light of your circumstances and financial resources. Past performance is no guarantee of future returns. Sprott Global, entities that it controls, family, friends, employees, associates, and others may hold positions in the securities it recommends to clients, and may sell the same at any time.
04:44
Unknown
Are Commodities at a Major Turning Point?
As most of you probably know, I have been expecting the CRB to form a major three year cycle low sometime next summer. However, I'm now starting to see some things that might indicate a major cycle bottom is going to occur earlier than I expected.
Since oil is the main driver of the CRB, and most COMMODITIES will follow its lead, I'm going to focus on the action in oil. Notice in the next chart that oil has now reached oversold levels similar to, if not more extreme than, the previous two 3 year cycle lows.
will follow its lead, I'm going to focus on the action in oil. Notice in the next chart that oil has now reached oversold levels similar to, if not more extreme than, the previous two 3 year cycle lows.
Sentiment in the COMMODITY complex is also at levels last seen at the previous multi-year cycle turning points.
complex is also at levels last seen at the previous multi-year cycle turning points.
After breaking through support at $1180 GOLD has now dropped far enough to test the 61% Fibonacci retracement of the previous C-wave rally. Yes, I have been expecting a move all the way back down to $1050, but it's entirely possible that the drop may come up $100 short and bottom at $1150 if the CRB is putting in a three year cycle low right here and now.
has now dropped far enough to test the 61% Fibonacci retracement of the previous C-wave rally. Yes, I have been expecting a move all the way back down to $1050, but it's entirely possible that the drop may come up $100 short and bottom at $1150 if the CRB is putting in a three year cycle low right here and now.
I believe oil is the key. When it finds its intermediate and yearly cycle bottom the rest of the COMMODITY complex is going to turn back up. And in Elliot wave terms oil has started its fifth wave down.
complex is going to turn back up. And in Elliot wave terms oil has started its fifth wave down.
We're only days away from a bottom, and it's even possible the bottom will form exactly on Election Day as it did in 2012.
The movements in the currency MARKETS are also connected very strongly with the commodity cycles. Notice in the next chart that the euro is within a whisker of testing its 200 month moving average where it has bottomed twice in the past. Once the euro finds a major cycle bottom the dollar is going to put in a larger degree top.
are also connected very strongly with the commodity cycles. Notice in the next chart that the euro is within a whisker of testing its 200 month moving average where it has bottomed twice in the past. Once the euro finds a major cycle bottom the dollar is going to put in a larger degree top.
In the next chart of the dollar notice that it is approaching a level where the Fed has cried uncle in the past and acted to turn the CURRENCY back down. Also, on a purely cyclical basis, the bottom in May of this year just does not have the DNA markers of a true three year cycle low. I know I'm the only cycles analyst saying this, but I think the three year cycle in the dollar is stretching and we are in the process of putting in a major multi-year top right now with a very stretched three year cycle low to be achieved sometime in the next one or two years.
back down. Also, on a purely cyclical basis, the bottom in May of this year just does not have the DNA markers of a true three year cycle low. I know I'm the only cycles analyst saying this, but I think the three year cycle in the dollar is stretching and we are in the process of putting in a major multi-year top right now with a very stretched three year cycle low to be achieved sometime in the next one or two years.
So for now we wait and watch the energy MARKETS as they are the key. When oil finds its intermediate and yearly cycle bottom look for the rest of the commodity markets to turn and follow it higher, and all this nonsense about now being the time to buy a gas guzzling SUV will soon be long forgotten.
as they are the key. When oil finds its intermediate and yearly cycle bottom look for the rest of the commodity markets to turn and follow it higher, and all this nonsense about now being the time to buy a gas guzzling SUV will soon be long forgotten.
Subscribe to:
Posts
(
Atom
)


