Sunday, 28 December 2014

Could Platinum And Palladium Outperform Gold In 2015?


There is a well-chronicled seasonal spreading strategy published by Moore Research Center Inc. (MRCI) that reveals how platinum futures historically have outpaced gold futures during the October through April period over the last 15 years.
That doesn't mean gold is set for a crash, but it does underscore a seasonal tendency for platinum to outperform gold during that time period.
Platinum is both a precious and an industrial metal. Industrial applications include wide use in automotive catalytic converters. Platinum is especially efficient in diesel engines. Diesel           is projected to overtake gasoline as the number one transportation fuel by 2010, according to research by ExxonMobil, which ultimately should support underlying demand for platinum in the industrial sector.
According to a BofA Merrill Lynch Global Research report, the firm forecasts gold prices at $1,225 in 2015, with platinum at $1,438 and palladium at $925. Those represent healthy gains for both platinum and palladium from current levels—see the charts below.
All the metals are projected to continue to rise in 2016, with a forecast at $1,300 in gold, $1,600 in platinum and $1,000 in palladium. Farther out in 2021—the BofA Merrill Lynch Global Research report forecasts continued gains with gold at $1,508, platinum at $2,001 and palladium at $1,053.
What are the key levels to watch now?
January platinum futures have carved out a type of "triple bottom" on the daily chart. See Figure 1 below. Strong support has formed in the $1,186 to $1,175 region. The key technical chart points are seen at Point A and Point B, the December swing high at $1,256 and the October 9 high at $1,294.80. It would take a strong rally through the $1,295 region to confirm a major bottom on the daily chart and open up the door to a strong rally move in the months ahead.

Shifting over to palladium, BofA Merrill Lynch research highlights palladium as a potential winner in 2015. "Palladium has been in deficit for years and as such has the strongest fundamentals in the metals complex. This gives a firm foundation for further price gains going forward," according to a BofA Merrill Lynch Global research note.
The palladium chart looks healthy and strong. Take a look at Figure 2 below, a monthly continuation chart of palladium futures.

Drilling down to a daily chart of palladium, the 2015 price target identified in the BofA Merrill Lynch Global Research report leaves scope for a big rally ahead.

Bottom line? Gold may face some headwinds in 2015 amid U.S. dollar strength and tighter monetary policy from the U.S. Federal Reserve, but longer-term targets still estimate higher prices for gold in the years ahead, along with strength in both platinum and palladium.

Could Russia back its currency with gold?


Russia's government could still be pushed into using its gold reserves to bolster the falling ruble, currency experts have forecast.

Rumors last week that Russia was on the verge of selling its gold reserves were quashed with the news on Friday that it has continued to add to its holdings. However, John Butler, chief investment officer at Atom Capital, and Alasdair MacLeod, the head of research at online bullion exchange GoldMoney Foundation, believe that Russian President Vladimir Putin could bring the country onto some sort of "gold standard" to try to shore up its economy.

"It was (and still is) in Russia's power to adopt a gold standard," MacLeod told CNBC via email.

"There is no doubt that Russia and China, plus the other Eurasian states in their sphere of influence are all accumulating gold and the indications are they see it as central to replacing the U.S. dollar for cross border trade."

Whether Russia would actually decide to do it was another matter, said MacLeod, and expected the country's central bank to the lack the courage to act. However, he said that if Putin is "provoked sufficiently" he may judge it to be in Russia's best interests and could overpower any reluctant officials at the bank.
Read MoreShould America worry about a China-Russia axis?
"It is already in Russia's interest to cast itself off from inflating western currencies and to base their economy on sound money, aka gold," he said.
GP Kidd | Cultura | Getty Images
Countries that are indebted and provide substantial welfare for its citizens would be most threatened by any return to gold convertibility, according to MacLeod, who said Russia could therefore be building a "weapon of mass financial destruction."

The Nixon administration has been credited with originally breaking the link between gold and the dollar in the early 1970s amid surging inflation, rising costs from the Vietnam War, and an oil crisis.

Before that, fixed amounts of gold were directly convertible to the U.S. dollar and vice versa. That meant money supply theoretically was limited by the amount of gold backing it, and exchange rates were based on the difference in price for an ounce of gold between the dollar and a foreign currency.
Russia has been aggressively buying the commodity in recent years and has formed closer currency ties with neighboring China in the process. Russia's gold holdings rose to 38.2 million ounces as of December 1, according to a statement by the central bank on Friday. This was a rise from a figure of 37.6 million from the month before, and allayed fears that it had sold the precious metal for dollars so it could further rebalance the ruble. The Russian currency had a torrid week, plunging by more than 11 percent last Tuesday — its steepest intraday fall since 1998.

Jim Rickards, the senior managing director at Tangent Capital and who has written extensively on the subject, told CNBC via email that Russia will move to a gold-backed currency but believes that such a move could be a long way off.

Read More What Russia-China relations mean for the dollar
<p>Putin's speech seemed 'relatively calm'</p> <p>Commenting on the Putin's recent speech, Simon Quijano-Evans, head of EM research at Commerzbank, says the press conference started off "relatively calm" and that Putin appears to be trying to act on negotiating terms.</p>
"Russia will continue to acquire gold, but will need hard currency reserves also to bridge the gap between today's position and any future intentions," he said.

One major drawback for Russia is that the ruble is already heavily linked to the price of oil and a gold-backed currency would link it to a second commodity, according to Phoenix Kalen, the director of emerging markets strategy at Societe Generale.

Thus, this would hinder usage of the "freely" floating currency as a shock-absorbing mechanism for its economy, she said.

I think it's highly unlikely that Russia would move toward a gold-backed currency," she told CNBC via email.

"At this point in time, it may make more sense for Russia to accumulate gold reserves, as it would help the country to diversify away from U.S. assets, stay ahead of the U.S. monetary policy tightening cycle which may adversely impact U.S. Treasury holdings, and benefit from the inflation protection provided by gold assets."
The Industry Catalogue of ...Gold Bars Worldwide  

Barb Moriarty

Years ago I purchased the most wonderful gold book I have ever seen:-

The Industry Catalogue of Gold Bars Worldwide, published by Grendon International Research PTY Ltd in 1998.

It was compiled by Nigel Desebrock and it is 344 pages of the most gorgeous photographs of the range of standard, innovative and unusual gold bars that were available, worldwide, in the 1990s. And is packed with details of the world's accredited refiners and bar manufacturers.

At AUD 279 (Ozzy dollars) it didn't come 'cheap,' but over the years, we have bought several copies of this amazing Catalogue for special people.

It is now available, until 31st December 2014 for AUD 175 (including courier delivery from Australia).

Order here: http://grendon.com.au/orderform.htm

More information and table of contents.

For those of you who do not feel comfortable ordering from the www, you can rest assured that your privacy and personal details will be respected 100 percent.

A human being will handle your order, and Brigida is lovely.

Please note that Brigida is located in Perth where the time is 13 hours ahead of Eastern Standard Time.

Barb Moriarty

Miners Extremely Oversold as Tax Loss Selling Ends

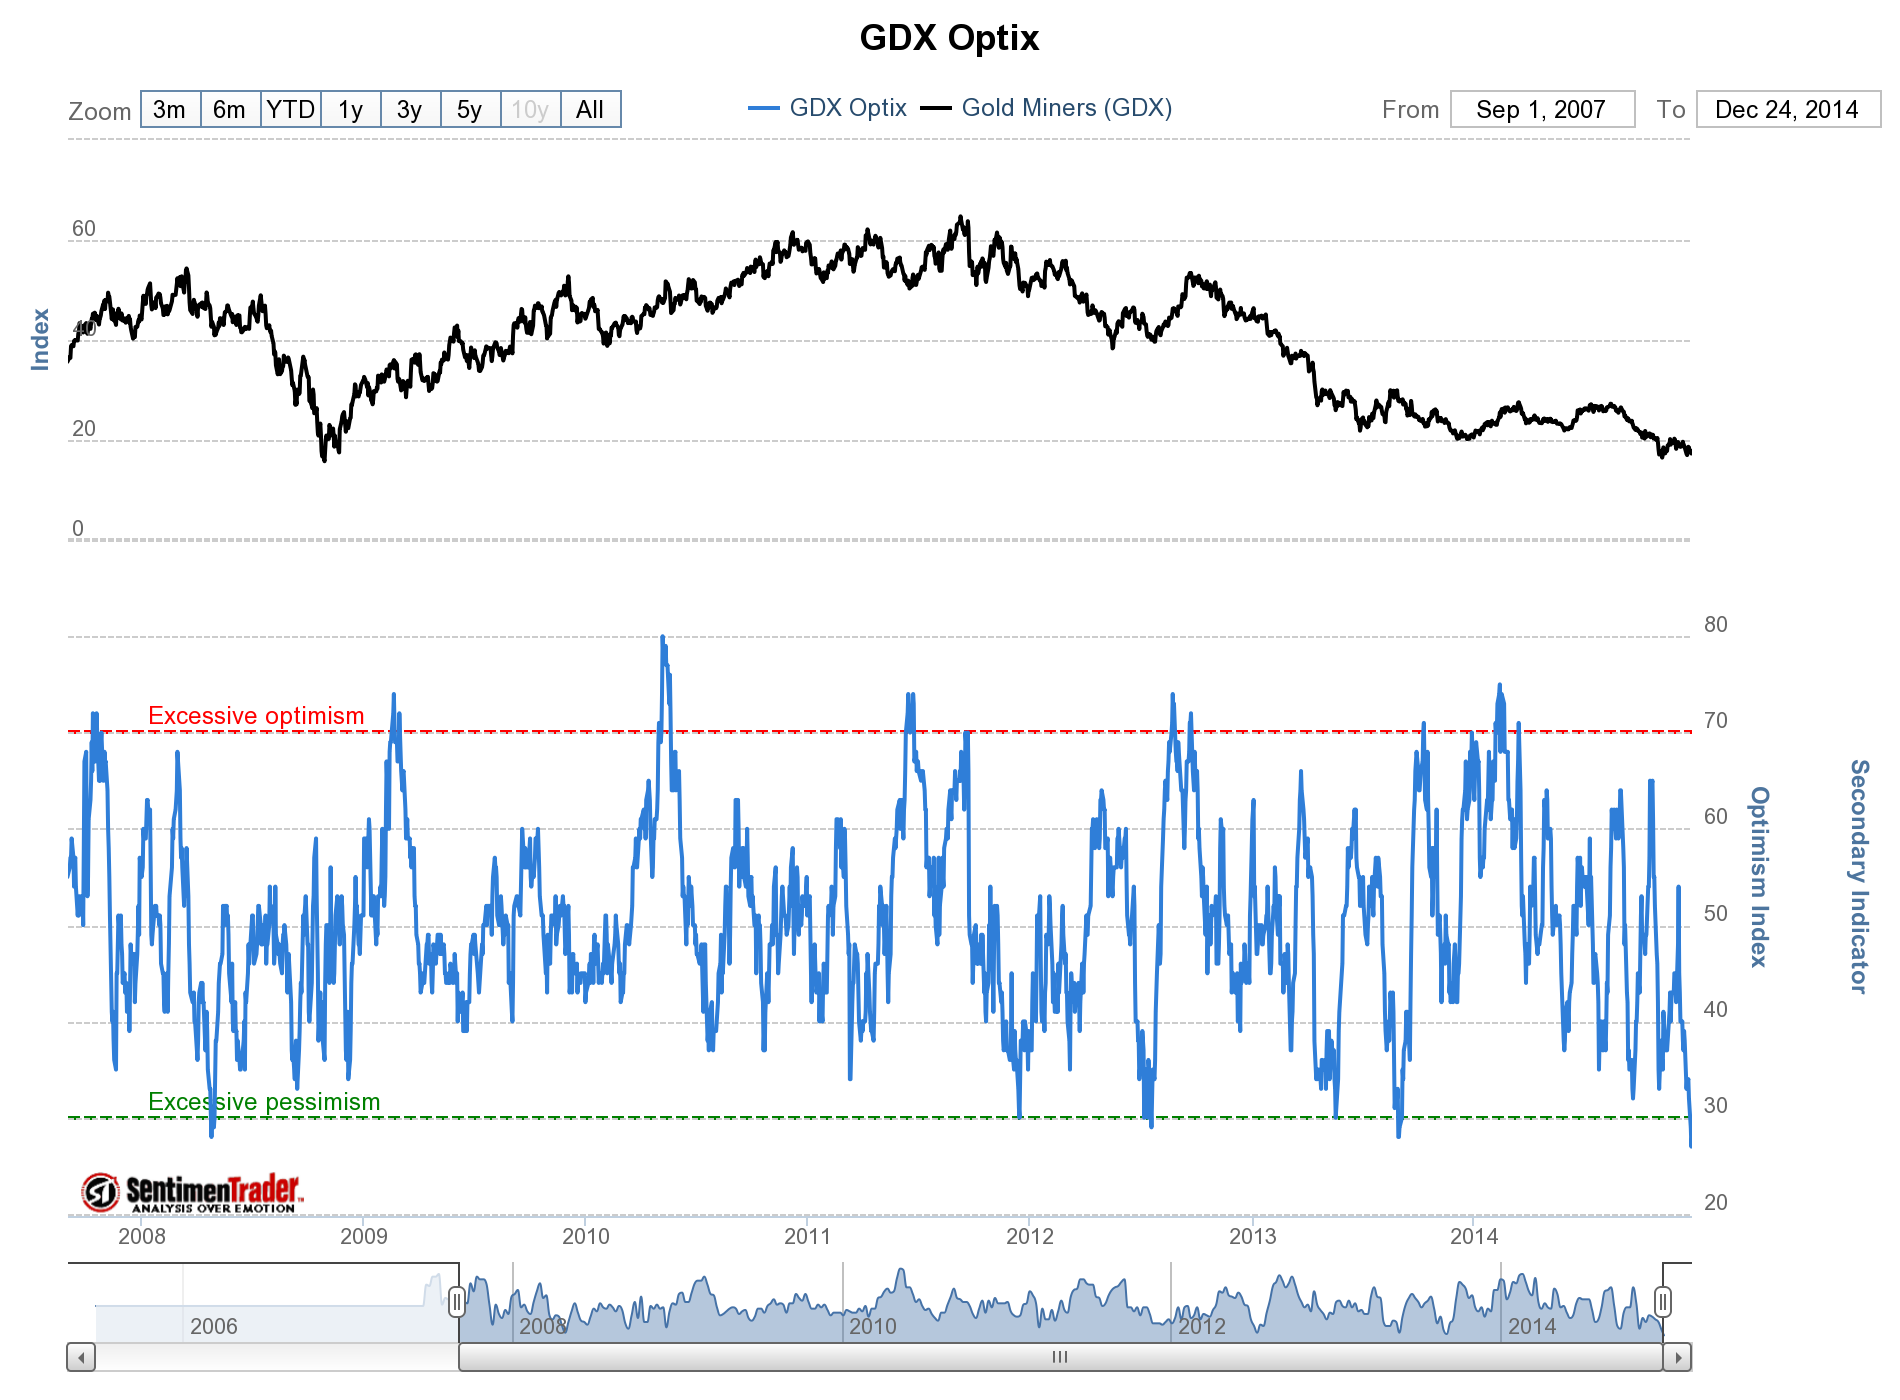
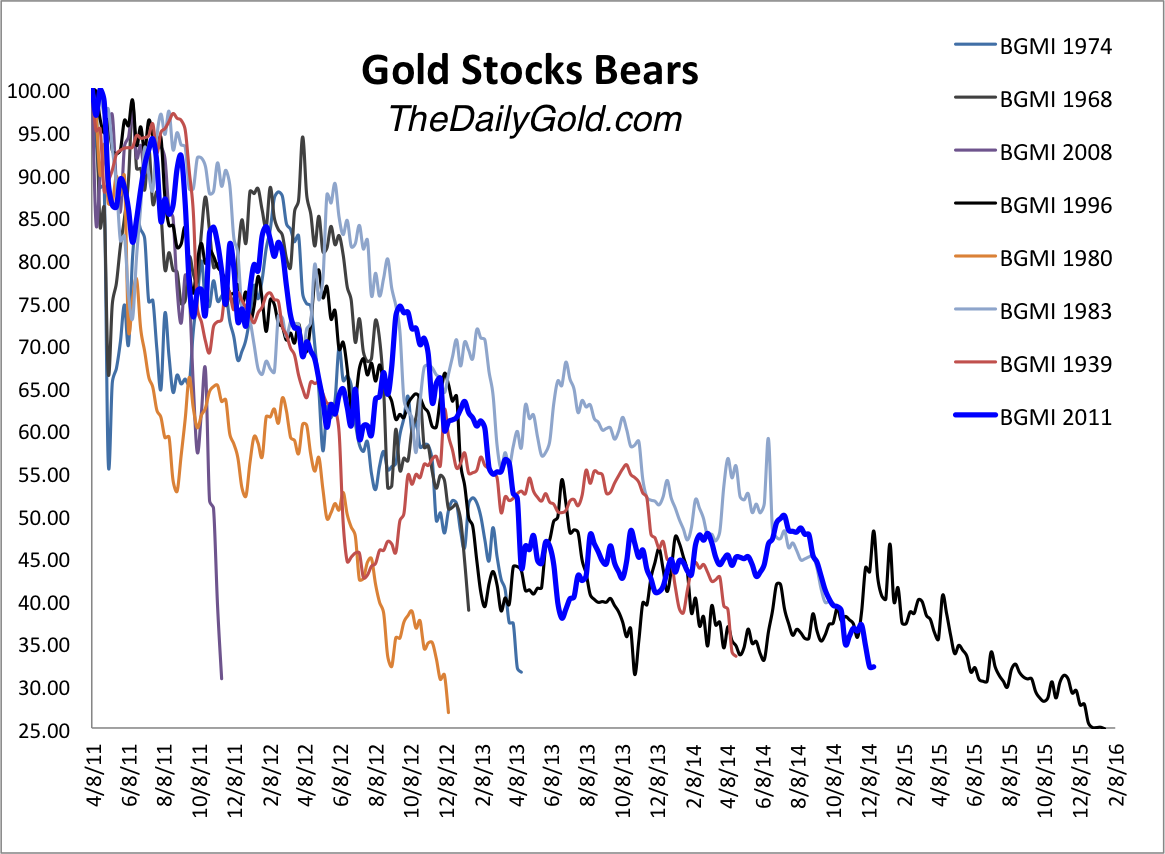
Another December and gold stocks have reached another extreme oversold condition. This was the case precisely 365 days ago and the precious metals complex, led by the miners rebounded strongly for nearly three months. A year later and the gold stocks are even more oversold. They’ve been in a bear market for more than three and a half years and in terms of price are very close to matching the worst bear market of all 1996-2000. Only time will tell if this is truly the end of the bear market but in any case miners have a shot to start 2015 off positively.
The following sentiment indicator was developed by sentimentrader.com. For various ETFs it considers options activity, fund flows, the discount to NAV and future volatility expectations. Like any indicator, it is only a single indicator and is best used in conjunction with other indicators. Interestingly, the Optix for GDX touched 27% two days ago. That is the lowest since GDX began trading in 2006.

dec25edgdxsent


Breadth indicators also indicate an extreme oversold condition in the miners. The bullish percentage index (% of stocks on a P&F buy signal) for the GDM index (forerunner to GDX) is currently at only 3% but was at 0% at last weeks low. It has only ticked 0% a handful of times in the past two years. Second, the percentage of stocks in the HUI trading above their 200-day moving average is currently 6% but was 0% at last weeks low. The last time both indicators were at 0% together (as they were last week) was in late 2008.
Here is a look at the updated bear analogs for the gold stocks. We use the Barron’s Gold Mining Index as it has the longest history. The current bear is in line with the 1996-2000 bear. After declining 69% over two and a half years that bear mounted a rebound that lasted over a year. That was followed by a decline to new lows. The current bear is down 68% and at this point on the scale is in the worst shape relative to all the other bears.

dec19bgmibears

For further comparison to the 1996-2000 bear, consider the figures for the other indices. Then the XAU declined 73%. At its recent low it was down 73%. Then the HUI declined 83%. It’s been down as much as 77% in this bear. The GDM index has lost 75% in this bear market and 77% in the 1996-2000 bear market. Meanwhile, GDXJ has lost up to 86% in the current bear market.
As we noted last week, the miners appear to be holding their November low and have a tradeable setup. The HUI is trading between 155 and 175 while GDX is trading between 17 and 20. A short-term rally to resistance is definitely possible. Given the current extreme oversold condition, are the miners ready to rebound through resistance and rally the way they did last January? On the other hand, will the metals cooperate? After 2013 tax loss selling, GDXJ rebounded over 50% within two months. We are working hard to prepare subscribers for this opportunity. Consider learning more about our premium service which includes a report on our top 5 stocks to buy.

Good Luck!

Jordan Roy-Byrne, CMT
Implications for the Stock Market and Gold with a Yen Rally

Summary
  • The Yen has undergone a massive devaluation against the dollar in recent years
  • US and Japan interest differentials suggests the Yen slide may reverse course
  • A Yen rally could cause stocks to falter and gold to shine in 2015
Since late 2012, the Yen has fallen nearly 40% as the Bank of Japan (BOJ) has launched an all-out war to devalue its currency. The forces that would likely drive this push were no mystery. As outlined on Financial Sense in June 2012 (see Massive Japanese Debt Monetization Is Coming, Yen to be Devalued), Japan's ticking time bomb of debt was coming head to head with its demographic time bomb, which forced the BOJ to act. This can be seen in the handoff below as aging Japanese citizens began to sell their debt holdings while the BOJ ramped up.
japan bonds
Source: Bloomberg
The launch of quantitative easing (QE) in Japan late in 2012 opened the door for the yen-carry trade to be revived again as the following article from early 2013 highlights:
Remember the Yen Carry Trade? Well, It’s Back
As confidence returns to global markets, investors appear to be using the cheap yen once again to fund investments in risky assets — a trade that is likely to give the battered Japanese currency another boot lower in the months ahead, analysts said…
This backdrop coincides with a sentiment shift in financial markets, with investors increasingly moving into more risky assets.
"The yen is regaining its ground as a funding currency," said Jesper Bargmann, head of G11 currencies at Royal Bank of Scotland in Singapore. "Sentiment has changed in markets, pretty much since January 1. Risk appetite has returned, there's increased confidence and a search for yield, so the yen seems to be suffering as a result of that," he said…
A carry trade is when investors borrow in a low yielding currency, such as the yen, to fund investments in higher yielding assets somewhere else…
A weakening currency is central to the carry trade since it means that investors have less to repay when they cash out of the trade.
I don’t believe it is just coincidence that the USD surged relative to the Yen late in 2012 to early 2014 at the same time the U.S. stock market soared as shown below.
Yen Russell 2000
Source: Bloomberg
Given the rather dramatic decline in the Yen relative to the USD over the last two years, it makes sense to reevaluate how much more downside the Yen has and what the implications would be should the Yen rally in 2015. One way to analyze currency movements is based on interest rate parity (click for definition) in which currency exchange rates should move in line with the differential between country interest rates. As shown below, this theory more or less works in which the USD/JPY exchange rate tracks the difference between US 10-yr interest rates and Japanese 10-yr interest rates. However, there are times when the two diverge and these large divergences eventually get unwound rather sharply (see yellow shaded boxes below). We’ve seen three cases in recent years with one in 2010, 2011, and one in 2013. In all of these the JPY/USD exchange rate got the direction right and the interest rate differential played catch up. We are currently experiencing our fourth major divergence in recent years in which the USD has rapidly appreciated relative to the Yen and yet US long term interest rates have not risen relative to Japan; in fact, the interest rate differential has declined (see red shaded box).
Interest Rate Diff
Source: Bloomberg
This divergence can be unwound by the Yen rallying relative to the USD and the USD/JPY exchange rate falls, or US long-term interest rates can rise relative to Japanese to close the gap. Which event occurs in the months ahead (yen rally or US interest rates rally) will have very different outcomes for the market. If the Yen rallies and the USD/JPY exchange rate falls the Yen-carry trade will start to unwind and with it one element of market liquidity. As shown above, when the USD rallies relative to the Yen we tend to see strong U.S. stock market returns and so if the USD falls relative to the Yen we could see some market weakness ahead. In fact, if the Yen should decline we would be witnessing a backdrop that we haven’t seen since 2012: no QE from the U.S. Fed and a strong Yen—two major liquidity supports for U.S. financial markets for the last two years.
We’ve seen how QE has tended to float the U.S. stock market higher and when QE was turned off the stock market would stumble. However, the Fed embarked an open-ended QE late in 2012 such that QE was running for all of 2013 and the bulk of 2014 and coincident with this time frame was a massive devaluation of the Yen. The S&P 500 soared during these times in which both added liquidity to the system, which is shown by the green shaded regions below while the yellow regions show only an expansion in the Fed’s balance sheet. We’ve had a lot of stimulus over the past two years coming from Fed's QE and the Yen-carry trade. We know the Fed's QE is over and should we also lose the Yen-carry trade we could be in store for a bumpier ride than we’ve seen recently.
QE and Yen
Source: Bloomberg
As mentioned above, the divergence between the USD/JPY exchange rate and the interest rate spread between the US and Japan can be resolved in two ways and my inclination is that we see the USD weaken relative to the Yen in the weeks and months ahead. Why? One reason, as shown above, is that the USD/JPY exchange rate is bumping up to resistance at the ~$120 level, which is the 2005-2007 resistance zone. So, from a technical standpoint it’s hard to see the USD appreciate further without some digestion and consolidation.
Secondly, from a purchasing power parity perspective (click for definition) the Yen is at its cheapest valuations relative to the USD since the middle 1980s. Using Bloomberg’s purchasing power parity function with the Consumer Price Index (CPI), Producer Price Index (PPI), and the annual OECD estimates, the Yen is between 15% to 34% undervalued relative to the USD. Given the multi-decade lows in Yen valuations, a further depreciation of the Yen appears unlikely.
Yen PPI
Source: Bloomberg
Yen PPI
Source: Bloomberg
Yen OECD
Source: Bloomberg
Assuming for the sake of argument that the Yen does cool off in early 2015, what can we come to expect? As mentioned above, the Yen-carry trade has been associated with positive stock market returns and so an unwinding of the Yen-carry trade in which the Yen appreciates relative to the USD could see a weaker stock market, particularly coupled with the removal of US QE. Secondly, we could also see a pick up in overall investor anxiety in which safe haven assets like gold benefit. Both the Yen and gold peaked in 2011 and accelerated their down falls late in 2012. Should we see stabilization in the Yen ahead we could see stronger gold prices in 2015.
Yen Gold
Source: Bloomberg
Also associated with Yen strength is a pickup in volatility as the Yen-carry liquidity tide goes out. This is shown below with the USD/JPY exchange rate shown inverted along with the Volatility index (VIX) with periods of Yen appreciation shown by the yellow shaded regions.
Yen Vix
Source: Bloomberg
Summary
In my last article (click for link) I made the case that the U.S. was not at risk of slipping into a recession and the hallmarks of a bull market top were missing and thus argued the weakness experienced in December was a buying opportunity. The market has since rebounded sharply in recent days and looks like it will experience the seasonal Santa Claus rally into year-end and we could see some strength spill over into 2015.

Oil Follows Gold’s Crash Pattern

McClellan Financial Publications

December 24, 2014
With oil prices having been cut in half over the past 6 months, many analysts are forecasting what this means for the economy, for jobs, for consumer spending, etc. But what I find interesting is the exact nature of the decline itself, and its resemblance to another recent decline in gold prices.
We have to go back to 1986 to find a similar decline in oil prices. There admittedly was a huge decline in 2008, from $145 down to $37 in just 8 months, but it came as the result of the pricking of a huge commodities bubble. There was also a huge decline in 1990-91, when Saddam Hussein spiked oil prices up to $40/barrel after he annexed Kuwait, and then prices crashed back down to $18. Each of those declines was from a price top that was way above prior levels.
But in 1986, there was a decline from a horizontal price structure, when the Saudis abandoned OPEC oil quotas. That decline was much like what we have just seen in 2014, also coming on Saudi action, and out of a flat price structure. And perhaps more interestingly, in 2013 there was another big decline from a flat structure, but not in oil prices. That 2013 decline was in gold prices, as shown in the top chart above.
The magnitude and the urgency of the price declines in gold and oil are similar, which made it reasonable for me to look at their patterns to see if there are other resemblances. Indeed there are, although the patterns do not really fall into step until around the July 2013 point in oil’s price history. That equates to the January 2012 price bottom for gold prices. Stating it more simply: Oil is now doing what gold was doing 18 months before.
The correlation has not always existed. The two patterns seem to have fallen into step together beginning around July 2013. Before then, the correlation was almost detectable, but not nearly as good as it came to be after that point. The implication of the current correlation is that if the recent pattern resemblance continues, then we should see a robust bounce in oil prices over the next 3 months. But while such a bounce would get everyone excited about a supposed new bull market in oil prices, that hope should be illusory.
As long as we are talking about the resemblance of oil’s late-2014 price slide to that of gold back in early 2013, it is also appropriate to once again make the comparison of gold’s current price pattern to what we saw before in the SP500. I showed this previously back on June 26, 2013.
Since then, gold has roughly followed the pattern laid down by the SP500, although the correlation has been imperfect. My sense is that if the Fed had not slathered the market with a whole bunch of quantitative easing (QE) to boost stock prices, we would have seen a better correlation. Still, the recent bottoming action in gold prices in 2014 matches the bottoming action of the SP500 in 2010, in the months following the May 2010 Flash Crash.
One important caveat is that these types of price pattern analogs tend to last for a while, and then they suddenly can stop working, usually at the moment when one is counting on them most to continue working.
So to summarize, the 2008-09 drop in stock prices saw an echo in the 2013 drop in gold prices, which has now had its further echo in 2014 for crude oil prices. There is a similarity in the way that investors panic out of their holdings in each, and that common physics/psychology shows up as a similar pattern in the price plot. More importantly for oil traders, we have now likely seen the climax point for the oil price decline, and up next is a robust but failing rebound which should get everyone excited about oil again in 2015, only to disappoint them all over again.

Friday, 26 December 2014

Implications for the Stock Market and Gold with a Yen Rally


Summary
  • The Yen has undergone a massive devaluation against the dollar in recent years
  • US and Japan interest differentials suggests the Yen slide may reverse course
  • A Yen rally could cause stocks to falter and gold to shine in 2015
Since late 2012, the Yen has fallen nearly 40% as the Bank of Japan (BOJ) has launched an all-out war to devalue its currency. The forces that would likely drive this push were no mystery. As outlined on Financial Sense in June 2012 (see Massive Japanese Debt Monetization Is Coming, Yen to be Devalued), Japan's ticking time bomb of debt was coming head to head with its demographic time bomb, which forced the BOJ to act. This can be seen in the handoff below as aging Japanese citizens began to sell their debt holdings while the BOJ ramped up.
japan bonds
Source: Bloomberg
The launch of quantitative easing (QE) in Japan late in 2012 opened the door for the yen-carry trade to be revived again as the following article from early 2013 highlights:
Remember the Yen Carry Trade? Well, It’s Back
As confidence returns to global markets, investors appear to be using the cheap yen once again to fund investments in risky assets — a trade that is likely to give the battered Japanese currency another boot lower in the months ahead, analysts said…
This backdrop coincides with a sentiment shift in financial markets, with investors increasingly moving into more risky assets.
"The yen is regaining its ground as a funding currency," said Jesper Bargmann, head of G11 currencies at Royal Bank of Scotland in Singapore. "Sentiment has changed in markets, pretty much since January 1. Risk appetite has returned, there's increased confidence and a search for yield, so the yen seems to be suffering as a result of that," he said…
A carry trade is when investors borrow in a low yielding currency, such as the yen, to fund investments in higher yielding assets somewhere else…
A weakening currency is central to the carry trade since it means that investors have less to repay when they cash out of the trade.
I don’t believe it is just coincidence that the USD surged relative to the Yen late in 2012 to early 2014 at the same time the U.S. stock market soared as shown below.
Yen Russell 2000
Source: Bloomberg
Given the rather dramatic decline in the Yen relative to the USD over the last two years, it makes sense to reevaluate how much more downside the Yen has and what the implications would be should the Yen rally in 2015. One way to analyze currency movements is based on interest rate parity (click for definition) in which currency exchange rates should move in line with the differential between country interest rates. As shown below, this theory more or less works in which the USD/JPY exchange rate tracks the difference between US 10-yr interest rates and Japanese 10-yr interest rates. However, there are times when the two diverge and these large divergences eventually get unwound rather sharply (see yellow shaded boxes below). We’ve seen three cases in recent years with one in 2010, 2011, and one in 2013. In all of these the JPY/USD exchange rate got the direction right and the interest rate differential played catch up. We are currently experiencing our fourth major divergence in recent years in which the USD has rapidly appreciated relative to the Yen and yet US long term interest rates have not risen relative to Japan; in fact, the interest rate differential has declined (see red shaded box).
Interest Rate Diff
Source: Bloomberg
This divergence can be unwound by the Yen rallying relative to the USD and the USD/JPY exchange rate falls, or US long-term interest rates can rise relative to Japanese to close the gap. Which event occurs in the months ahead (yen rally or US interest rates rally) will have very different outcomes for the market. If the Yen rallies and the USD/JPY exchange rate falls the Yen-carry trade will start to unwind and with it one element of market liquidity. As shown above, when the USD rallies relative to the Yen we tend to see strong U.S. stock market returns and so if the USD falls relative to the Yen we could see some market weakness ahead. In fact, if the Yen should decline we would be witnessing a backdrop that we haven’t seen since 2012: no QE from the U.S. Fed and a strong Yen—two major liquidity supports for U.S. financial markets for the last two years.
We’ve seen how QE has tended to float the U.S. stock market higher and when QE was turned off the stock market would stumble. However, the Fed embarked an open-ended QE late in 2012 such that QE was running for all of 2013 and the bulk of 2014 and coincident with this time frame was a massive devaluation of the Yen. The S&P 500 soared during these times in which both added liquidity to the system, which is shown by the green shaded regions below while the yellow regions show only an expansion in the Fed’s balance sheet. We’ve had a lot of stimulus over the past two years coming from Fed's QE and the Yen-carry trade. We know the Fed's QE is over and should we also lose the Yen-carry trade we could be in store for a bumpier ride than we’ve seen recently.
QE and Yen
Source: Bloomberg
As mentioned above, the divergence between the USD/JPY exchange rate and the interest rate spread between the US and Japan can be resolved in two ways and my inclination is that we see the USD weaken relative to the Yen in the weeks and months ahead. Why? One reason, as shown above, is that the USD/JPY exchange rate is bumping up to resistance at the ~$120 level, which is the 2005-2007 resistance zone. So, from a technical standpoint it’s hard to see the USD appreciate further without some digestion and consolidation.
Secondly, from a purchasing power parity perspective (click for definition) the Yen is at its cheapest valuations relative to the USD since the middle 1980s. Using Bloomberg’s purchasing power parity function with the Consumer Price Index (CPI), Producer Price Index (PPI), and the annual OECD estimates, the Yen is between 15% to 34% undervalued relative to the USD. Given the multi-decade lows in Yen valuations, a further depreciation of the Yen appears unlikely.
Yen PPI
Source: Bloomberg
Yen PPI
Source: Bloomberg
Yen OECD
Source: Bloomberg
Assuming for the sake of argument that the Yen does cool off in early 2015, what can we come to expect? As mentioned above, the Yen-carry trade has been associated with positive stock market returns and so an unwinding of the Yen-carry trade in which the Yen appreciates relative to the USD could see a weaker stock market, particularly coupled with the removal of US QE. Secondly, we could also see a pick up in overall investor anxiety in which safe haven assets like gold benefit. Both the Yen and gold peaked in 2011 and accelerated their down falls late in 2012. Should we see stabilization in the Yen ahead we could see stronger gold prices in 2015.
Yen Gold
Source: Bloomberg
Also associated with Yen strength is a pickup in volatility as the Yen-carry liquidity tide goes out. This is shown below with the USD/JPY exchange rate shown inverted along with the Volatility index (VIX) with periods of Yen appreciation shown by the yellow shaded regions.
Yen Vix
Source: Bloomberg
Summary
In my last article (click for link) I made the case that the U.S. was not at risk of slipping into a recession and the hallmarks of a bull market top were missing and thus argued the weakness experienced in December was a buying opportunity. The market has since rebounded sharply in recent days and looks like it will experience the seasonal Santa Claus rally into year-end and we could see some strength spill over into 2015.
While I still do not see the signs of a recession or a bear market on the horizon that is not to say we can’t see a pickup in volatility or market gyrations in the year ahead. In fact, I think the most bullish theme one can be on in 2015 is a pickup in volatility with the removal of QE and a possible Yen-carry trade unwinding.
As highlighted in this article, there is a large divergence between the USD/Yen exchange rate and their associated interest rate differentials and my belief is this divergence will be resolved by the USD weakening relative to the Yen in the weeks and months ahead. Should this occur we could see a rough start to 2015 with stocks weakening while gold rallies. The biggest theme I see for 2015 is a pickup in volatility and the best advice for that kind of climate is to stay humble as the market whips around here and there and confuses bulls and bears alike, and to stay nimble as market volatility always creates opportunities.

Oil Follows Gold’s Crash Pattern

McClellan Financial Publications, Inc
Posted Dec 27, 2014

December 24, 2014
With oil prices having been cut in half over the past 6 months, many analysts are forecasting what this means for the economy, for jobs, for consumer spending, etc. But what I find interesting is the exact nature of the decline itself, and its resemblance to another recent decline in gold prices.
We have to go back to 1986 to find a similar decline in oil prices. There admittedly was a huge decline in 2008, from $145 down to $37 in just 8 months, but it came as the result of the pricking of a huge commodities bubble. There was also a huge decline in 1990-91, when Saddam Hussein spiked oil prices up to $40/barrel after he annexed Kuwait, and then prices crashed back down to $18. Each of those declines was from a price top that was way above prior levels.
But in 1986, there was a decline from a horizontal price structure, when the Saudis abandoned OPEC oil quotas. That decline was much like what we have just seen in 2014, also coming on Saudi action, and out of a flat price structure. And perhaps more interestingly, in 2013 there was another big decline from a flat structure, but not in oil prices. That 2013 decline was in gold prices, as shown in the top chart above.
The magnitude and the urgency of the price declines in gold and oil are similar, which made it reasonable for me to look at their patterns to see if there are other resemblances. Indeed there are, although the patterns do not really fall into step until around the July 2013 point in oil’s price history. That equates to the January 2012 price bottom for gold prices. Stating it more simply: Oil is now doing what gold was doing 18 months before.
The correlation has not always existed. The two patterns seem to have fallen into step together beginning around July 2013. Before then, the correlation was almost detectable, but not nearly as good as it came to be after that point. The implication of the current correlation is that if the recent pattern resemblance continues, then we should see a robust bounce in oil prices over the next 3 months. But while such a bounce would get everyone excited about a supposed new bull market in oil prices, that hope should be illusory.
As long as we are talking about the resemblance of oil’s late-2014 price slide to that of gold back in early 2013, it is also appropriate to once again make the comparison of gold’s current price pattern to what we saw before in the SP500. I showed this previously back on June 26, 2013.
Since then, gold has roughly followed the pattern laid down by the SP500, although the correlation has been imperfect. My sense is that if the Fed had not slathered the market with a whole bunch of quantitative easing (QE) to boost stock prices, we would have seen a better correlation. Still, the recent bottoming action in gold prices in 2014 matches the bottoming action of the SP500 in 2010, in the months following the May 2010 Flash Crash.
One important caveat is that these types of price pattern analogs tend to last for a while, and then they suddenly can stop working, usually at the moment when one is counting on them most to continue working.
So to summarize, the 2008-09 drop in stock prices saw an echo in the 2013 drop in gold prices, which has now had its further echo in 2014 for crude oil prices. There is a similarity in the way that investors panic out of their holdings in each, and that common physics/psychology shows up as a similar pattern in the price plot. More importantly for oil traders, we have now likely seen the climax point for the oil price decline, and up next is a robust but failing rebound which should get everyone excited about oil again in 2015, only to disappoint them all over again.
***
Related Charts
Christmas week market schedule
PennTrade

Dear PennTrader:

Here's the holiday schedule for U.S. and Canadian exchanges.

Wednesday, Dec 24 -- Christmas Eve
US and Canadian markets are open only half-day. Both close at 1pm EST - that's 10am PST. PennTrade will close then also.

Thursday, Dec 25 -- Christmas Day
US and Canadian markets are closed for Christmas. So are we.

Friday, Dec 26 -- Boxing Day
US markets are open normal hours. Canadian markets stay closed for Boxing Day. PennTrade is open regular hours.

Monday, Dec 29
Things return to normal. US and Canadian markets are open regular hours, and so is PennTrade.

All of us at PennTrade wish you and yours a Very Merry Christmas.

As Tiny Tim said, "God bless us, every one!"

Ron Nicklas
President

New African Gold Miner

Scott Wright


The 2000s gold bull has brought a lot of attention to West Africa. This attention has not always translated to success given the unstable geopolitical environment in this part of the world. But the diligent miners able to endure and overcome the challenges have been rewarded with some major discoveries that have been developed into profitable gold mines.
One country really thriving is Ghana. On the geopolitical front there's probably no safer country in Africa with its government acting under a stable long-standing constitutional democracy and its tax and mining laws fairly well-legislated. And on the geological front there's definitely no rival, with Ghana host to four massive underexplored gold-rich greenstone belts.
Ghana's gold-mining success has resulted in a 35% increase in output over the last decade. It has grown to become Africa's second-largest gold producer, and the 10th largest in the world. And when Asanko Gold's flagship mine commissions in 2016, this country will see another huge boost in production.
The Asanko Gold we see today is a new-look company via its early-2014 acquisition of PMI Gold. Old Asanko (formerly Keegan Resources) and PMI were both early movers into West Africa. And their marriage is a match made in heaven given their outstanding logistical and corporate synergies.
This deal ended up bringing together the former Esaase and Obotan projects to form the newly-dubbed Asanko Gold Mine (AGM). AGM is located in the emerging Asankrangwa gold belt, just to the west of the better-known Ashanti gold belt where Newmont, AngloGold, and Goldfields operate several prolific gold mines. And its complex of deposits combine to make it one of the most robust gold projects in Ghana.
Obotan and Esaase are located about 30km apart. And both projects are known to have long histories of smaller-scale artisanal mining. This mining was primarily alluvial in nature, though it pointed towards an accessible hard-rock source. And the larger mining companies indeed found this source when they applied modern exploration techniques.
Obotan's mineralization was the most intriguing early on. And large Australian miner Resolute Mining was able to delineate a multi-million-ounce deposit that it started mining via open-pit methods in the late 1990s. Unfortunately this operation was prematurely shut down as a result of bear-market-low gold prices around the turn of the century. And it ended up producing 730k ounces in this first go-around.
With gold prices heading higher in the subsequent years, Obotan and its large in-ground resource naturally attracted attention. And PMI Gold was the lucky winner of its prospecting license in 2006. That same year Asanko Gold took over the Esaase project located just northwest. And this kicked off an exploration cycle that would highlight the vast potential of the Asankrangwa gold belt.
Obotan and its flagship Nkran deposit was especially impressive. PMI's aggressive exploration had uncovered a large richly-mineralized gold zone much more robust than Resolute had defined. Per the latest resource estimate it was found to hold 4.5m ounces of gold, including 2.5m ounces in the proven-and-probable reserve categories. And it was this core reserve base that would feed a wildly positive feasibility study in 2012.
PMI was able to procure Obotan's mining lease shortly after completing the feasibility study. And in 2013 it continued to explore the project while performing pre-development work in preparation for a mine build. The critical component of this build was financing, which is no easy feat in these crummy gold markets. So PMI eventually decided its best bet would be to team up with neighbor and deeper-pocketed Asanko Gold.
Asanko's Esaase project was advancing nicely, but it was keenly aware that Obotan was the real treasure of this emerging gold belt. Provocatively AKG had tried to acquire PMI about a year earlier, but to no avail. Its diligence paid off though, with the second go-around closing in February 2014.
Within a few months of the acquisition Asanko Gold approved construction at Obotan. And this would be the first of two phases in building out the greater and newly-dubbed Asanko Gold Mine. Obotan's development would be followed by Esaase's. And at full commercial production AGM will be one of Africa's largest gold mines, producing in the neighborhood of 400k ounces per year.
Phase one's $295m price tag is fully funded with the new company's combined treasury and debt facility. And it is expected to pour its first gold in Q1 2016. And per a Definitive Project Plan just announced in November, this fantastic mine ought to be profitable even at lower gold prices.
Mining will occur via conventional open-pit methods. Since the ore is fresh/sulfide it'll require milling, employing crush/grind/gravity/carbon-in-leach circuits. And the operation will run at a life-of-mine mill-feed rate of 8.2k metric tons per day. With life-of-mine recoveries and average grades that exceed 92% and 2.0 g/t respectively, phase-one production will average 190k ounces annually over a 12-year mine life.
AGM's phase-one gold will be produced at all-in sustaining costs of only $781/ounce, easily in the lower quartile of industry average. And this will allow for a solid 20% after-tax internal rate of return at $1150 gold, and the IRR would obviously increase proportionally if AGM's gold is sold at higher prices.
Phase-two production will come from the nearby Esaase deposit. Esaase is a grassroots discovery made by Asanko Gold. And its extensive exploration has defined a massive 5.9m-ounce deposit. AKG has performed multiple economic assessments at Esaase over the years. And the latest, a 2013 prefeasibility study, showed this project to also hold great economic potential.
Mining would focus on Esaase's core 2.4m-ounce reserve base. The ore would need to be milled like Obotan's, but processing would require the extra step of running through a flotation circuit. Feed grades and recoveries are a little lower than Obotan's, but all-in sustaining costs would still be under $1000/ounce. And at a throughput rate of nearly 14k tpd, production from Esaase would average about 200k ounces per year over a 10-year mine life.
Interestingly since this PFS was performed prior to the PMI acquisition and was based on a standalone operation, it is essentially obsolete. Since Esaase will now be developed as the second phase of a larger mining operation, there are numerous synergies that ought to drastically improve the economics.
The biggest cost savings will come from not having to build standalone processing facilities. Esaase is close enough to Obotan that its ore can be trucked. The existing facility would need to be expanded and a flotation circuit would need to be added in order to accept Esaase's ore, but presumably this would be much cheaper than building a full onsite facility from the ground up at Esaase.
There will also likely be many operational synergies. And for this reason AKG is in the process of performing a scoping study that would incorporate Esaase into a larger phased mining operation. This study is expected to be completed in Q1 2015. And if it comes back positive as expected, it ought to lead to more feasibility work that would hopefully culminate in development shortly after phase one achieves commercial production and starts spinning out cash.
Overall Asanko Gold's AGM is one of the world's elite development-stage gold projects. Its first phase of operation is fully permitted and fully funded. And thanks to rough market conditions that have annihilated the gold-mining sector, investors have the opportunity to get onboard this emerging mid-tier producer at bargain-basement prices.
As you can see in this four-year chart, Asanko Gold's stock has fallen sharply since its 2011 all-time high. And the primary driver for this decline is the price action of AKG's underlying metal. Since gold's own 2011 all-time high, it has fallen into a deep dark cyclical bear market that has taken it to levels not seen since 2009. And this has been none too kind to highly-leveraged gold stocks like AKG.
AKG's descent into bear-market mode got a kick start in September 2011 upon the release of Esaase's first PFS. Unfortunately this PFS wasn't well-received by the markets as a result of much higher costs than what was outlined in the previous assessment. Couple this with gold's major September beat down, and AKG would see its stock price nearly cut in half in short order.
AKG finally caught its breath when gold bounced the following month, but it would be rough sailing over the next several years as gold gave up its ghost and entered into bear-market territory. With such an ugly downtrend there aren't many positives to analyze from a technical perspective. So the true test of AKG's resolve is how it performs on the rare occasions when gold gets legs.
Since its 2011 high gold has forged four meaningful uplegs. And it should be expected that gold stocks outperform their underlying metal amidst such uplegs. If they don't, there's really no reason to own them given their outsized risks compared to gold itself. And as you can see, AKG has been a consistent outperformer.
In the first two uplegs in 2012 AKG positively leveraged gold 3.0x, rising an average of 47% to gold's 15%. AKG performed even better in 2013's Q3 snapback upleg, soaring 67% to gold's 18% (3.7x leverage). And then in early 2014 AKG again performed well, rising 51% to gold's 16% (3.2x leverage).
This stock has already shown the ability to pop when gold shows signs of life. And since it is in better fundamental shape now than it was in these past uplegs, it really ought to fly when gold runs higher. The new-look Asanko Gold's 10m+ ounce resource base really ought to attract investors when they return to this space. And with mine development now underway, institutional investors and the larger mining companies will take AKG a lot more seriously.
Overall AKG ranks as one of only a handful of quality junior gold stocks poised to thrive when gold turns the corner. The carnage of the last few years has really taken its toll on this sector, but this group is ready to roll when interest returns. And now is the time to load up on these stocks while they're trading at such crazy-low levels.
At Zeal we perform exhaustive research in a quest to identify the best of the best in a given sector. And we recently scrubbed the universe of junior gold stocks trading in the US and Canada in order to identify those that are best-fundamentally-equipped to lead the way. Our brand-new hot-off-the-presses research report profiles our favorite dozen, including Asanko Gold. Buy your report today to learn about which junior golds we believe will most thrive!
We also publish acclaimed weekly and monthly newsletters for contrarian speculators and investors. In them we draw on our decades of experience, wisdom, and knowledge to provide expert analysis on what's going on in these fascinating markets. And we leverage our research with contrarian trade recommendations that ought to thrive in the months ahead, with major financial-market changes coming. Get your subscription today!
The bottom line is new-look Asanko Gold controls the heart of one of Ghana's most-exciting new gold belts. AKG's flagship AGM project is host to over 10m ounces of gold resources. And a series of positive feasibility studies shows that its core reserves are amenable to profitable mining.
Asanko Gold will develop this exciting new mine in two phases, with fully-permitted and fully-funded phase one construction now underway. AGM is expected to pour its first gold in Q1 2016. And investors are able to take advantage of bargain-basement prices today to get in on one of the world's premier gold-mine-development projects.