 19:43
19:43
 Unknown
From Gold Bear to Gold Bull?
Below is a weekly candle chart of Gold and Silver. Thursday’s Swiss-induced strength helped propel the yellow metal above key resistance at $1240-$1250. Over the past four months Gold has had every opportunity to sustain prices below $1200. Within that period Gold made four different lows from $1150 to $1200. The action of the past two weeks and the break above resistance is a strong signal of an important trend change. Silver breaking its resistance would offer further confirmation of a broad trend change in the sector.
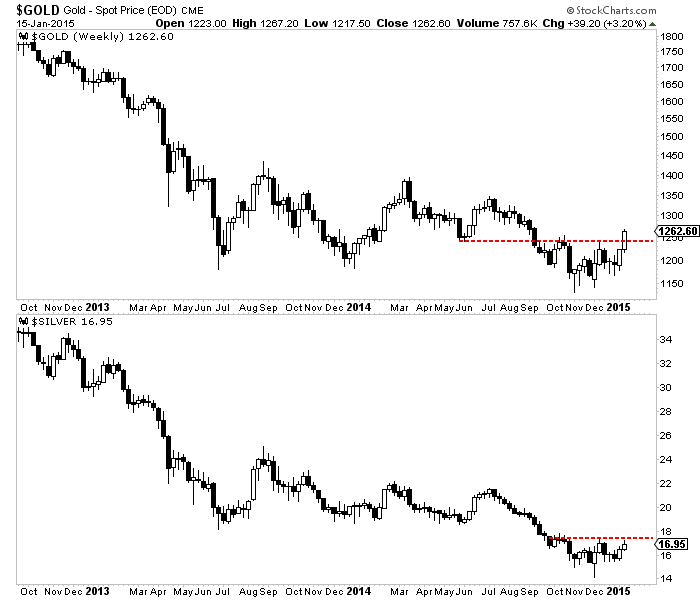
Gold & Silver Weekly Candle Chart
We’ve written often about Gold’s relative strength and its importance in signaling a forthcoming trend change. On Thursday Gold closed at a 20-month high in Euro and foreign currency terms and is nearing a two year high against commodities. For months Gold had remained weak against US and global equities. At present Gold is starting to break those downtrends. Below we plot Gold against various equity indices (NYSE, Dow Jones World, MS World, S&P 500).
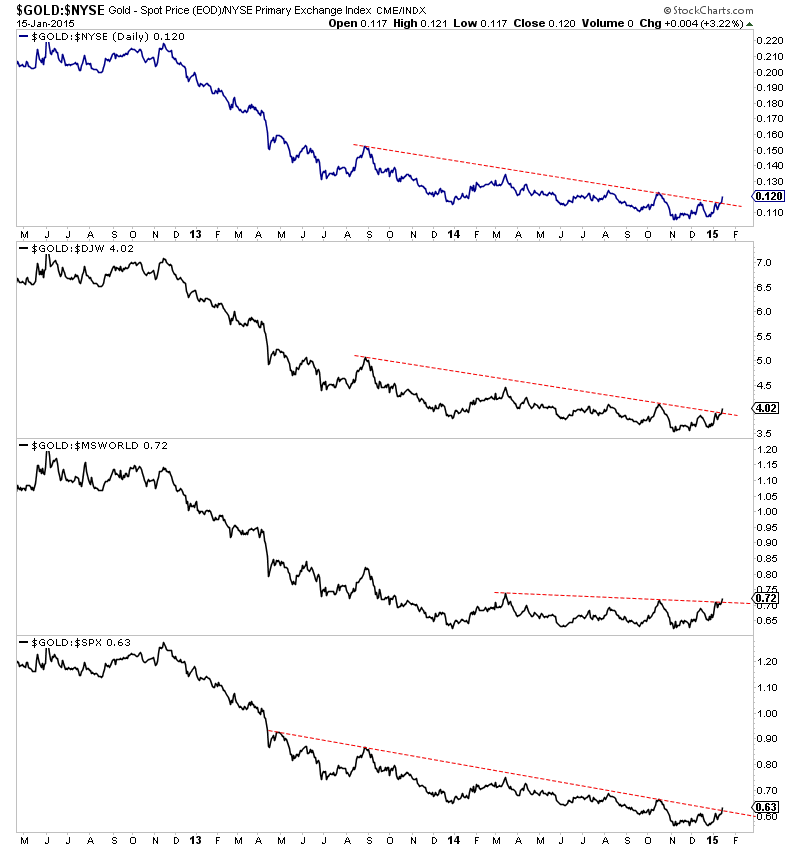
Gold vs. Equities
Meanwhile, the miners have confirmed the rise in Gold. With the exception of GDXJ, every major index has completed a double bottom and is trading around three month highs. The chart below shows the daily line charts of GDXJ and GDX. We include the 400-day moving average which is often an excellent indicator of the long-term trend. The next important resistance figures to be the 400-day moving average. That could coincide with Gold at $1280.
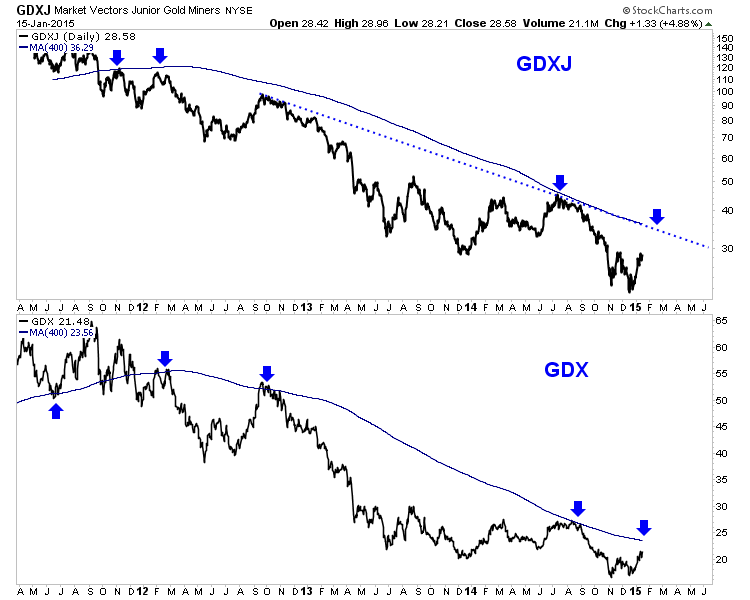
Gold Miners (GDX) & Junior Gold Miners (GDXJ)


• Tata Metaliks Limited net zooms 54%
ReplyDelete• Gold prices slip on stronger dollar
Stock Advisory Company